Sainsbury's Deliveroo Partnership Nectar Integration: The Hidden Supply Chain Complexity Every FMCG Retail Leader Must Act On Now
Monday Morning Just Got Harder for Every FMCG Supplier in the UK
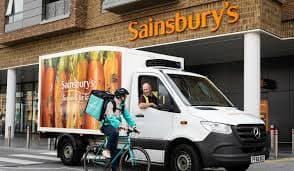
Sainsbury's has announced the integration of Deliveroo and Nectar into a unified omnichannel retail ecosystem. For shoppers, it is seamless. For supply chain planners, operations managers, demand forecasters, and retail business owners supplying into Sainsbury's - it is one more data pipeline to reconcile, one more source of forecast variance, and one more reason your planning meeting overruns.
This is not a future problem. It is an operational problem that has arrived this week.
Every retailer integration that looks like a consumer win creates a new layer of operational complexity for the brands supplying into it. Sainsbury's + Deliveroo + Nectar means you are now managing three reporting channels where you had two, with different data schemas, different reporting cadences, different definitions of what a "sale" even means, and a loyalty attribution model that splits demand causality across channels you cannot yet join.
And this is just Sainsbury's.
Tesco is next. Asda is next. Morrisons is building. Every major UK grocery retailer is racing to own the full customer relationship across in-store, online, and rapid delivery. Every integration they announce creates a new data layer you have to absorb without adding headcount to absorb it.
The retail business owners and supply chain leaders who understand this complexity early - and build the infrastructure to manage it - will operate with a planning advantage that compounds over the next 18 months. The ones who don't will spend the same 18 months firefighting variance investigations and manual reconciliations.
This report, produced by the GrowSights research team, gives you the full picture: what the integration means operationally, where the data breaks, what it costs your team, what is coming next across other retailers, and exactly what to do about it now.
Executive Summary: What Has Changed and What It Costs You
| Impact Area | Before Integration | After Integration |
|---|---|---|
| Reporting channels | 2 (in-store + online) | 3 (in-store + online + Deliveroo) |
| Data schemas to manage | 1 unified | 3 with different structures |
| Loyalty attribution | Nectar (in-store + online only) | Nectar across all 3 channels, split |
| Forecast model variables | Stable | 3–5 new variables added |
| Weekly reconciliation time (est.) | 2–3 hrs | 5–8 hrs |
| Promotional analysis reliability | High | Degraded - 3–5% accuracy loss |
| Inventory allocation visibility | Partial | Reduced - dark store allocation opaque |
| Headcount impact | Baseline | 0 added, workload +40% |
Section 1: Why Sainsbury's Is Doing This - and Why It Creates Complexity for You
1.1 The Strategic Logic of Retailer Integration
Sainsbury's integration of Deliveroo and Nectar is strategically coherent and commercially well-reasoned. The goal is to own the complete customer relationship across every purchase occasion:
SAINSBURY'S OMNICHANNEL OWNERSHIP MODEL

In-Store Purchase      ──┐
                          ├──► Nectar Loyalty Data  ──► Unified Customer Profile
Online Purchase        ──┤         (all channels)        ──► Personalised Promotions
                          │                               ──► Predictive Reordering
Deliveroo Rapid        ──┘                               ──► Lock-In Effect
Delivery
For Sainsbury's, this creates:
- A loyalty moat - Nectar points earned everywhere means customers have more reason to stay in the Sainsbury's ecosystem
- A data advantage- unified purchase behaviour across channels produces richer demand signals
- A rapid delivery capability - Deliveroo integration means competing with Amazon Fresh and Ocado on speed
- A margin expansion opportunity - rapid delivery typically carries premium pricing; Nectar incentivises the channel shift
This is smart retail strategy. For the 15 million Nectar loyalty members and the growing percentage of UK households using Deliveroo for grocery, it reduces friction at every touchpoint.
For you - the supplier - every one of those integration layers creates a new operational layer to manage.
1.2 What You Are Now Managing
Before the Deliveroo + Nectar announcement, a typical FMCG supplier's Sainsbury's data architecture looked like this:
BEFORE INTEGRATION - Supplier Data View

Sainsbury's Portal
    ├── In-Store Sales Data     (daily POS snapshots)
    └── Online Sales Data       (transactional, flagged separately)

One schema. Two channels. Manageable complexity.
After the integration, the same supplier's data architecture looks like this:
AFTER INTEGRATION - Supplier Data View

Sainsbury's Portal
    ├── In-Store Sales Data     (daily POS snapshots - unchanged)
    ├── Online Sales Data       (transactional - unchanged schema)
    └── Deliveroo via Sainsbury's (new - schema not yet stabilised)
         └── Sourced from dark stores / fulfilment network

Nectar Loyalty Attribution
    ├── In-store Nectar       (existing reporting)
    ├── Online Nectar         (existing reporting)
    └── Deliveroo Nectar      (new - split from in-store/online attribution)

Three schemas. Three channels. Four loyalty streams. Reporting lag times differ.
Definition of "sale" differs across channels.
Reconciliation complexity: +40%.
Section 2: The Four Operational Headaches - In Detail
2.1 Channel Fragmentation: Three Datasets You Cannot Simply Add Together
The most immediate problem is that three reporting channels do not produce three equivalent data streams. They produce three fundamentally different types of data that require normalisation before they can be combined.
REPORTING CADENCE AND SCHEMA COMPARISON

Channel          │ Reporting Type    │ Lag Time   │ "Sale" Definition
─────────────────┼───────────────────┼────────────┼──────────────────────────────
In-Store         │ POS snapshot      │ Daily      │ Completed at till
Online           │ Transactional     │ Near-real  │ Order placed (sometimes reserved-
                 │                   │ time       │ not-picked vs completed)
Deliveroo        │ TBD - schema not  │ Unknown    │ Reserved? Dispatched? Delivered?
                 │ yet stabilised    │            │ Definition not yet confirmed
The consequence: you cannot add the three channel numbers together and call it total demand. The reporting lag differences mean you are looking at different time windows. The sale definition differences mean units counted in one channel may be double-counted or excluded in another. And the Deliveroo schema is still being settled - which means the data you receive this quarter may change structure next quarter.
Forecast impact: Your Monday morning demand number is less reliable than it was last Monday. Not by a catastrophic margin - but enough to show up as unexplained variance in week three of your planning cycle.
2.2 Loyalty Data Split: You See the Symptom, Not the Cause
Here is the operational illustration from a real planning scenario:
ILLUSTRATIVE WEEKLY SKU PERFORMANCE - 1,200 UNITS TOTAL

Channel          │ Units Sold │ Active Promotion
─────────────────┼────────────┼─────────────────────────────────
In-Store         │    650     │ Double Nectar Points (Friday)
Online           │    320     │ Double Nectar Points (Friday)
Deliveroo        │    230     │ Double Nectar Points (Friday)
─────────────────┼────────────┼─────────────────────────────────
TOTAL            │  1,200     │

QUESTION YOUR FORECAST MODEL CANNOT ANSWER:
Were the 230 Deliveroo units driven by Nectar elasticity (loyalty incentive)?
Or did they cannibalise in-store (channel substitution)?
Or were they genuinely incremental demand?

Nectar attribution is split by channel in Sainsbury's reporting.
You are seeing aggregate movement - not channel-level causality.
This is not a small problem. Your promotional forecasting model is built on loyalty elasticity coefficients derived from historical Nectar data. That historical data was collected when Nectar operated across two channels. It is now operating across three - with different promotional mechanics per channel.
The elasticity coefficients you are using are wrong. Not dramatically wrong - but directionally wrong in a way that compounds across a full promotional calendar.
2.3 Inventory Allocation: Your Replenishment Algorithm Is Flying Blind
Before the Deliveroo integration, a typical weekly allocation of 5,000 units to Sainsbury's distributed approximately:
HISTORICAL INVENTORY ALLOCATION - PRE-DELIVEROO

In-Store Network    ████████████████████████████░░░░░░░░░░░   70%  (3,500 units)
Online Fulfilment   ████████████░░░░░░░░░░░░░░░░░░░░░░░░░░░   30%  (1,500 units)

Replenishment algorithm: calibrated to 70/30 split.
Forecast accuracy: stable.
Post-integration, Sainsbury's is shifting allocation to support rapid delivery demand from dark stores:
ESTIMATED NEW INVENTORY ALLOCATION - POST-DELIVEROO

In-Store Network    ████████████████████████░░░░░░░░░░░░░░░   55%  (2,750 units)
Online Fulfilment   █████████████░░░░░░░░░░░░░░░░░░░░░░░░░░   25%  (1,250 units)
Dark Store / Rapid  ████████░░░░░░░░░░░░░░░░░░░░░░░░░░░░░░░   20%  (1,000 units)

Replenishment algorithm: still calibrated to 70/30.
Result: over-allocation to in-store. Under-allocation to rapid delivery.
Consequence: stock-outs in dark stores. Excess in store network.
Sainsbury's will not tell you explicitly how they are shifting allocation. You will infer it from demand data -but demand data is split across three channels with different reporting lags. By the time you see the pattern clearly, the stock-out has already happened and the markdown on excess store stock is already in process.
2.4 Promotional Complexity: Your Forecast Model Has New Variables It Cannot Isolate
Consider this promotional scenario - not hypothetical, but the type of multi-channel promo architecture Sainsbury's is now able to run:
MULTI-CHANNEL PROMOTIONAL SCENARIO

In-Store:    BOGOF promotion          → +12% sales lift
Online:      £3.00 off               → +18% sales lift
Deliveroo:   Double Nectar Points    → +42% sales lift

YOUR FORECAST MODEL ASKS:
What drove the +42% Deliveroo lift?
  (A) Nectar loyalty elasticity (returning customers motivated by points)?
  (B) Channel trial acceleration (new Deliveroo users discovering the brand)?
  (C) Cannibalisation from in-store (existing buyers switching channel)?
  (D) Combination of all three in proportions you cannot measure?

Answer: You cannot currently separate (A), (B), (C), and (D).
The aggregate data does not have channel-level causal attribution.

Next quarter's planning assumption for loyalty elasticity: UNRELIABLE.
This will get more complex before it gets simpler. Sainsbury's next promotional iterations will include stacking mechanics - double Nectar in-store that also applies on Deliveroo, or Gold Nectar tier benefits exclusive to rapid delivery. Every new mechanic is a new variable in your demand model. Every variable you cannot isolate is a forecast error you absorb downstream.
Section 3: The Operational Cost - Invisible Work That Did Not Exist Before
Your supply chain team has not grown. But their workload has.
ESTIMATED WEEKLY OPERATIONAL COST - POST-INTEGRATION

Activity                          │ Before   │ After    │ Delta
──────────────────────────────────┼──────────┼──────────┼────────
Data reconciliation               │ 1–2 hrs  │ 3–4 hrs  │ +2 hrs
Variance investigation            │ 1 hr     │ 2–3 hrs  │ +1.5 hrs
Forecast model governance         │ 30 mins  │ 1–2 hrs  │ +1 hr
Retailer schema tracking          │ 0 hrs    │ 30 mins  │ +0.5 hrs
──────────────────────────────────┼──────────┼──────────┼────────
TOTAL WEEKLY HOURS                │ 2.5–3.5  │ 6.5–9.5  │ +5–6 hrs

Annualised: ~260–312 additional team-hours per year.
At a fully-loaded cost of £40–50/hr: £10,400–£15,600 in invisible operational drag.
Per year. Per retailer. Before Tesco. Before Asda. Before Morrisons.
This is not a line on anyone's budget. It is invisible work that accumulates in planning meetings that overrun, variance investigations that pull analysts away from strategic work, and forecast errors that show up as stockouts or excess that no one can fully explain.
Section 4: What Is Coming Next - The Retailer Integration Wave
Sainsbury's is not an isolated event. It is the leading indicator of a wave that will hit every major UK grocery supplier over the next 18 months.
UK GROCERY RETAILER INTEGRATION PIPELINE - 2026–2027

Retailer    │ Likely Move                         │ Timeline   │ Supplier Impact
────────────┼─────────────────────────────────────┼────────────┼─────────────────────
Tesco       │ Quick-commerce partnership           │ 2026       │ New data pipeline,
            │ (Whoosh expansion or new vertical)   │            │ dark store allocation
────────────┼─────────────────────────────────────┼────────────┼─────────────────────
Asda        │ Loyalty deepening across digital     │ 2026–Q1    │ New reporting schema,
            │ channels (Asda Rewards expansion)    │            │ loyalty attribution split
────────────┼─────────────────────────────────────┼────────────┼─────────────────────
Morrisons   │ Online grocery + rapid delivery      │ 2026–2027  │ Channel fragmentation,
            │ footprint expansion                  │            │ new forecast variables
────────────┼─────────────────────────────────────┼────────────┼─────────────────────
Ocado       │ Additional retail partnerships       │ Ongoing    │ SKU-level data
            │ and international expansion          │            │ complexity
Each one of these creates the same pattern: a consumer-facing announcement that looks like a win for shoppers, and a new operational layer for the supply chain teams managing those retailers.
If you supply into three major UK grocery retailers, you are not managing one version of this problem. You are managing three versions simultaneously - each with different schemas, different reporting cadences, different loyalty mechanics, and different dark store allocation strategies.
TOTAL COMPLEXITY PROJECTION - MULTI-RETAILER FMCG SUPPLIER (2026–2027)

Data sources to reconcile weekly:   2 (2025)  →  8–12 (late 2027)
Forecast model variables:           Stable     →  +15–20 new variables
Weekly reconciliation hours:        3–4 hrs    →  12–20 hrs
Forecast accuracy degradation:      Baseline   →  5–8% without infrastructure fix
Headcount added to manage it:       0           → 0 (budget doesn't allow it)
Section 5: Revenue Impact - What This Costs You If You Do Not Act
5.1 Forecast Error Cost at Scale
For a mid-market FMCG brand with £10M annual Sainsbury's revenue, a 3–5% forecast accuracy degradation translates into real commercial losses:
REVENUE IMPACT MODEL - £10M SAINSBURY'S ANNUAL REVENUE

Scenario                  │ Forecast Error │ Estimated Revenue Impact
──────────────────────────┼────────────────┼──────────────────────────
Stockout (under-forecast) │ 3% demand miss │ £300K lost revenue/year
Excess stock (over-fcst)  │ 3% over-order  │ £180–240K markdown/write-off
Promotional miss          │ 1 major event  │ £80–150K per quarter
Reconciliation overhead   │ 260–310 hrs/yr │ £10–15K fully-loaded cost
──────────────────────────┼────────────────┼──────────────────────────
TOTAL ANNUAL EXPOSURE     │                │ £570K–£705K

For a £20M Sainsbury's supplier: exposure doubles to £1.1M–£1.4M annually.
FORECAST ACCURACY DEGRADATION - BEFORE AND AFTER

BEFORE INTEGRATION
Forecast Accuracy  ████████████████████████████████████░░░░   92–95%

WEEKS AFTER INTEGRATION (no action taken)
Week 2–4           ████████████████████████████████░░░░░░░░   88–90%  (-4%)
Week 8–12          ████████████████████████████░░░░░░░░░░░░   87–88%  (-6%)
Stabilised (no fix)████████████████████████████░░░░░░░░░░░░   86–89%  ongoing

WITH UNIFIED DATA INFRASTRUCTURE
Week 2–4           ████████████████████████████████░░░░░░░░   88–91%  (transition)
Week 8–12          ████████████████████████████████████░░░░   92–94%  (recovering)
Stabilised         ████████████████████████████████████████   93–96%  (improved)
5.2 New Revenue Opportunity: Getting Data Right Creates Competitive Advantage
The commercial argument is not only defensive. FMCG suppliers who unify their data infrastructure ahead of this wave gain a measurable planning advantage over competitors who do not.
COMPETITIVE DATA ADVANTAGE - SKU PERFORMANCE COMPARISON

SUPPLIER A (Unified data infrastructure)
├── Sees Deliveroo channel demand in real time
├── Detects dark-store stock-out 48hrs before it becomes a lost sale
├── Isolates Nectar lift vs channel trial in promo analysis
├── Adjusts replenishment algorithm to 55/25/20 split proactively
└── Outcome: 2–3% better in-stock rate, stronger range review data

SUPPLIER B (Manual reconciliation, fragmented data)
├── Detects Deliveroo demand spike on Day 3 (after stockout starts)
├── Cannot separate Nectar lift from channel trial
├── Replenishes to historical 70/30 split (now wrong)
└── Outcome: 3–5% worse in-stock rate, weaker range review position
A 2–3% better in-stock rate at Sainsbury's does not just prevent stockout losses. It produces stronger EPOS data at range review, which directly influences whether your SKU retains or expands its listing. The competitive flywheel runs in both directions.
Section 6: What Retail Business Owners and Supply Chain Leaders Should Do - Right Now
6.1 Audit Your Data Pipelines Today
Before anything else, map what you are actually receiving from Sainsbury's today:
| Audit Question | Why It Matters |
|---|---|
| How many distinct data schemas are you receiving from Sainsbury's portal? | Confirms whether Deliveroo has a separate endpoint or is merged |
| What is the reporting lag on each channel? | Different lags = different effective time windows in your model |
| How is "sale" defined in each channel's data? | Reserved vs dispatched vs delivered = different unit counts |
| When does Nectar attribution split per channel? | Confirms whether loyalty lift is visible at channel level |
| What happens to your schema when Deliveroo reporting stabilises? | Schema changes mid-quarter will break any automation you build now |
Do not wait for Sainsbury's to document this proactively. Their optimisation is their revenue, not your forecast accuracy.
6.2 Version Your Forecast Model - Before It Degrades Silently
Your current demand model was built on pre-integration data. It is already operating on assumptions that are becoming less reliable. The risk is that forecast accuracy degrades gradually - 1% this week, another 1% in three weeks - and no one notices until a planning review reveals persistent unexplained variance.
Version the model now:
- Preserve your current "pre-Deliveroo integration" baseline as a named version
- Document which variables - loyalty elasticity, channel elasticity, promotional lift coefficients - are now unreliable
- Communicate to leadership: forecast accuracy will likely degrade 3–5% for 8–12 weeks while you rebuild on new data. This is not a team failure. It is a structural consequence of the integration. Surfacing it proactively is a leadership decision.
6.3 Build Reconciliation Infrastructure - Stop Doing This in Excel
The multi-sheet Excel reconciliation that is now absorbing 5–8 hours of your team's week is not a sustainable response to a problem that will only get more complex. You need a lightweight data pipeline:
TARGET DATA ARCHITECTURE - UNIFIED SAINSBURY'S DEMAND VIEW

Data Sources (Input)
├── Sainsbury's Portal - In-Store POS (daily)
├── Sainsbury's Portal - Online (transactional)
└── Sainsbury's Portal - Deliveroo (new endpoint)

Normalisation Layer
├── Schema standardisation (align sale definitions)
├── Lag-time adjustment (align reporting windows)
└── Channel tagging (preserve source for attribution)

Unified Demand View (Output)
├── Single daily demand file (all channels combined)
├── Channel-level breakout (for promo attribution)
├── Nectar attribution by channel (when available)
└── Reconciliation gap flags (automated alerts)

Tools: Fivetran, Zapier, Python ETL script, or lightweight BI connector.
This is not a 3-month IT project. A Python script running nightly can
deliver 80% of the value within 2–3 weeks.
Your Monday planning meeting runs on one source of truth, not three competing spreadsheets.
6.4 Establish Retailer Governance Conversations
Stop waiting for Sainsbury's to brief you. Schedule a quarterly retailer governance conversation with your account contact covering:
- Reporting schema changes: what is coming and when?
- Channel inventory allocation: how is the in-store / online / dark store split shifting?
- Promotional mechanics: what does next quarter's Nectar calendar look like?
- Loyalty attribution: at what level will Nectar data be reported to suppliers per channel?
Retailers are structured to optimise their revenue, not your forecast accuracy. The more intelligence you gather proactively in these conversations, the fewer mid-quarter surprises you absorb in your planning model.
Section 7: The Bigger Picture - Unified Data Is the Competitive Moat for 2026
What GrowSights is seeing across FMCG suppliers right now is a bifurcation. The market is splitting into two groups:
Group A: Unified data operators. These businesses have built or are building a single operational data view that connects retailer reporting, internal inventory, 3PL data, and CRM into one daily feed. When Sainsbury's shifts allocation, they see it in 24 hours. When a promotional mechanic changes, they can isolate it in the data. When Tesco announces their next integration, they add an endpoint - they do not rebuild their entire system.
Group B: Fragmented data operators. These businesses are still reconciling across multi-schema spreadsheets, investigating variance in planning meetings, and absorbing forecast errors that they can explain qualitatively but cannot fix quantitatively. They are not failing. They are simply absorbing 12–20 additional operational hours per week that their competitors are not.
DATA MATURITY SPECTRUM - FMCG SUPPLIERS 2026

FRAGMENTED                                           UNIFIED
     │                                                  │
     ▼                                                  ▼
Multi-sheet          Partial             Connected    Real-time
Excel                automation          pipelines    operational
reconciliation       (some tools)        (all sources)feed
     │                                                  │
     │   5–8 hrs      3–5 hrs           1–2 hrs      30 mins
     │   reconcile    reconcile         reconcile     automated
     │   /week        /week             /week         alerts
     │                                                  │
     └──────────────── Where are you today? ────────────┘
The competitive moat for supply chain teams in 2026 is not headcount. It is unified data infrastructure that moves faster than retailer strategy changes. The retailers are accelerating their integration pace. The question is whether your data infrastructure is accelerating to match.
Section 8: Three Questions to Answer Before the End of This Week
If you supply into Sainsbury's - or any major UK grocery retailer - these are the three questions that need answers before your next planning cycle:
Question 1: Pull your Sainsbury's data today. How many distinct schemas are you receiving? If the answer is "I'm not sure," that is the answer - and it tells you exactly where to start.
Question 2: Ask your Sainsbury's account contact: when does Deliveroo reporting fully integrate into the portal? When does Nectar attribution unify across channels? Put the dates in writing.
Question 3: Map your forecast model's variable set. Which variables - loyalty elasticity, promotional lift, channel attribution - are now being built on data you cannot fully trust? Those are the degradation points. Version the model now, before the variance shows up unexplained in week three.
Retailer integrations are not stopping. The operational complexity they create is solvable - but only if you see the problem clearly before it arrives in your demand planning cycle as unexplained numbers that nobody can account for.
The suppliers who unify their data infrastructure ahead of this wave will not just protect their forecast accuracy. They will build a planning advantage over competitors that compounds for the next three years.
The ones who don't will add it to the list of things they are firefighting indefinitely.
About GrowSights
GrowSights builds retail growth solutions for FMCG businesses, category managers, and retail operators navigating the structural shifts in modern UK retail. Our research and development team tracks retailer strategy, supply chain complexity, and data infrastructure across the UK grocery market.
Related GrowSights Intelligence:
- UK Mid-Market Retail Growth Stalled - What It Means for FMCG Brands
- Retail Growth Engineering by Category
- The SaaS Stack Tax on Retail Margin
- Start a Conversation with the GrowSights Team
Published May 2026. Research based on: original GrowSights supply chain analysis, Sainsbury's corporate announcements, UK grocery retail market intelligence, publicly available FMCG operational benchmarks. Revenue impact estimates are illustrative models based on typical mid-market FMCG supplier profiles and standard forecast accuracy benchmarks. GrowSights has no commercial relationship with Sainsbury's, Deliveroo, or Nectar at the time of publication.