Critical
Out of Stock
Shelf genuinely empty for a SKU with real demand. Catches failures early before revenue loss compounds.
Chase store or DC replenishment immediately.
For brands supplying Tesco, Sainsbury's, Asda & dark stores / quick commerce
Stockouts turns your daily retailer data into ranked, revenue-weighted alerts - each with exact lost revenue per day and the precise action to take.
£197,620+
in recoverable lost revenue found in week 1 of data - one retailer, one brand.
Used by a fast-growing FMCG brand managing £90M+ in annual UK retail revenue.
THE PROBLEM
01
By the time a weekly report flags a stockout, you've already lost 5–7 days of revenue. The shelf was empty. Nobody noticed. The window closed.
02
A stock report shows 200 SKUs out. It doesn't show which one is costing £56 a day — or which one hasn't sold in six months anyway. Everything looks equally urgent.
03
The report gives you a number. It doesn't say why it happened, what type of failure it is, or what to do before the next delivery window closes. The team guesses.
Every stockout has a warning sign. We help you see it.
FEATURE 01
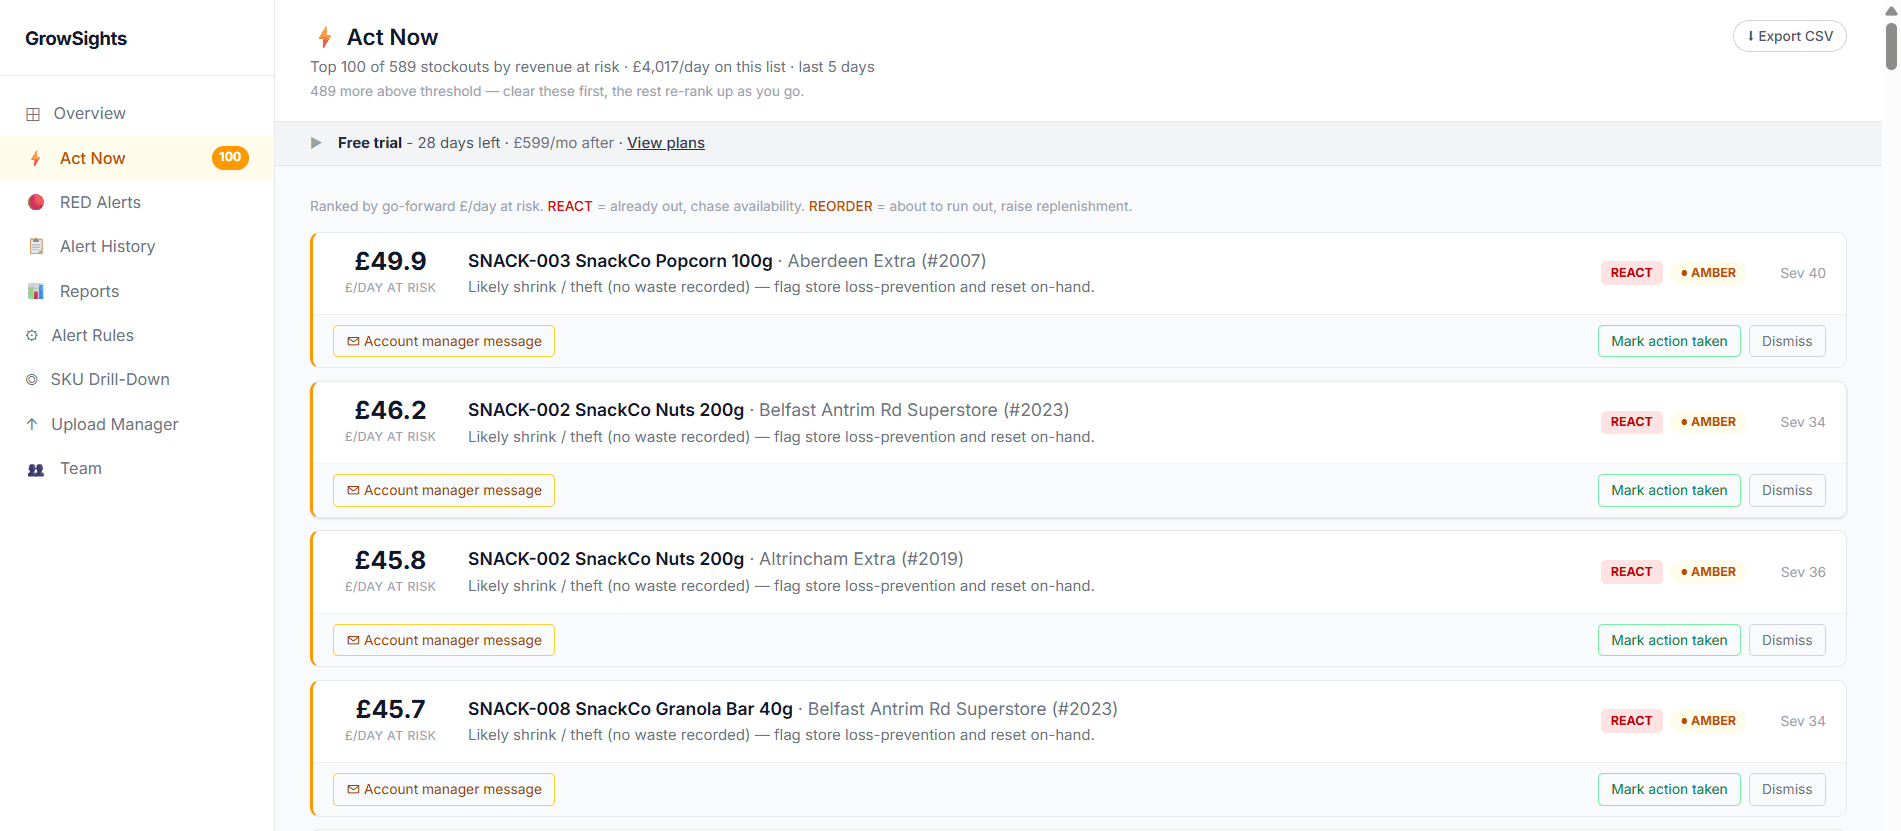
Every alert is ranked by its daily lost revenue, not just flagged 'out of stock.' Your team sees exactly which fires to fight first, with the recommended action attached.
FEATURE 02
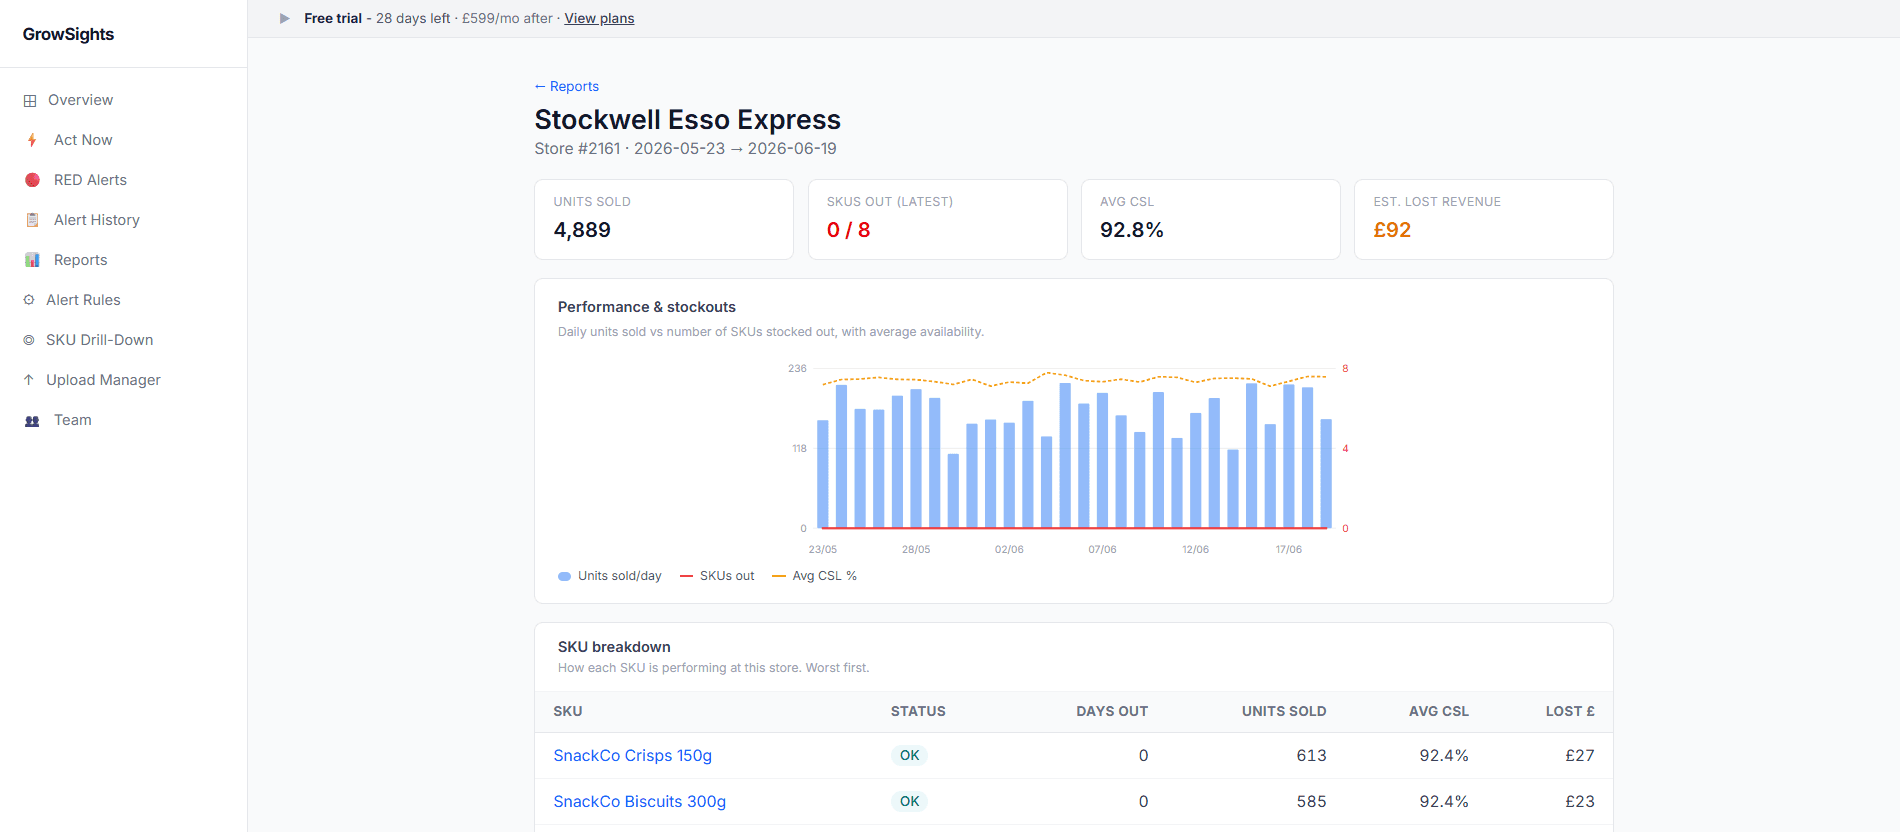
Drill into any store for its full picture - units sold, Customer Service Level (CSL), SKUs out, and total revenue lost to stockouts over any period.
FEATURE 03
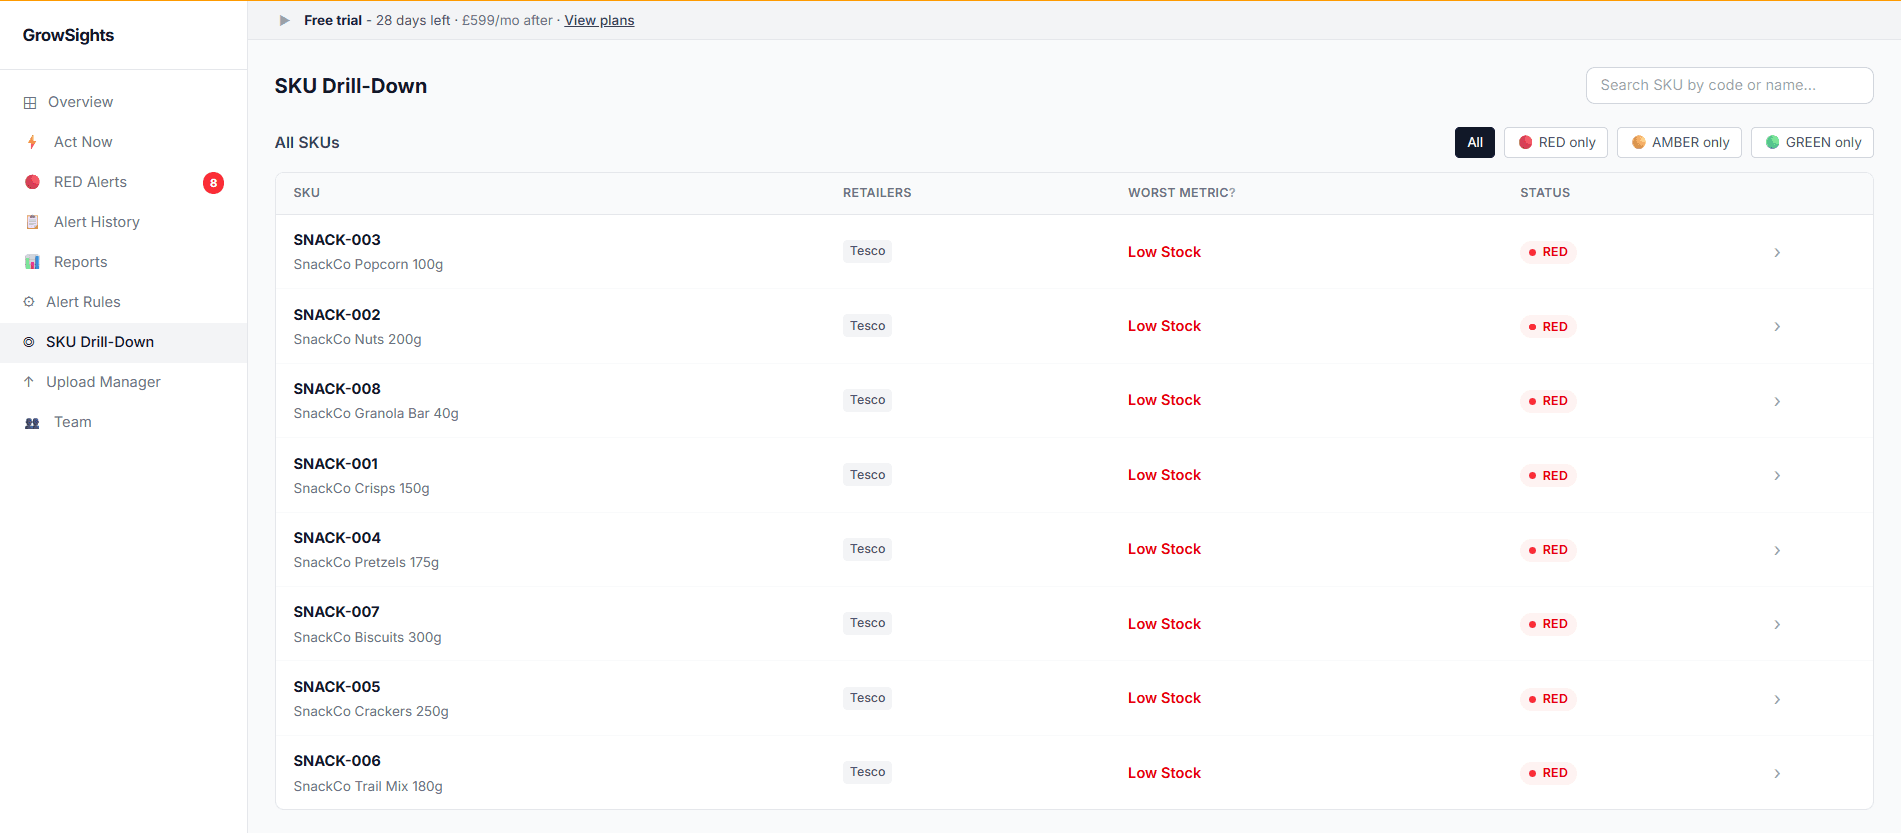
See the health of every SKU across all retailers in one view. Filter to RED, AMBER, or GREEN and surface the products demanding action before they become emergencies.
FEATURE 04
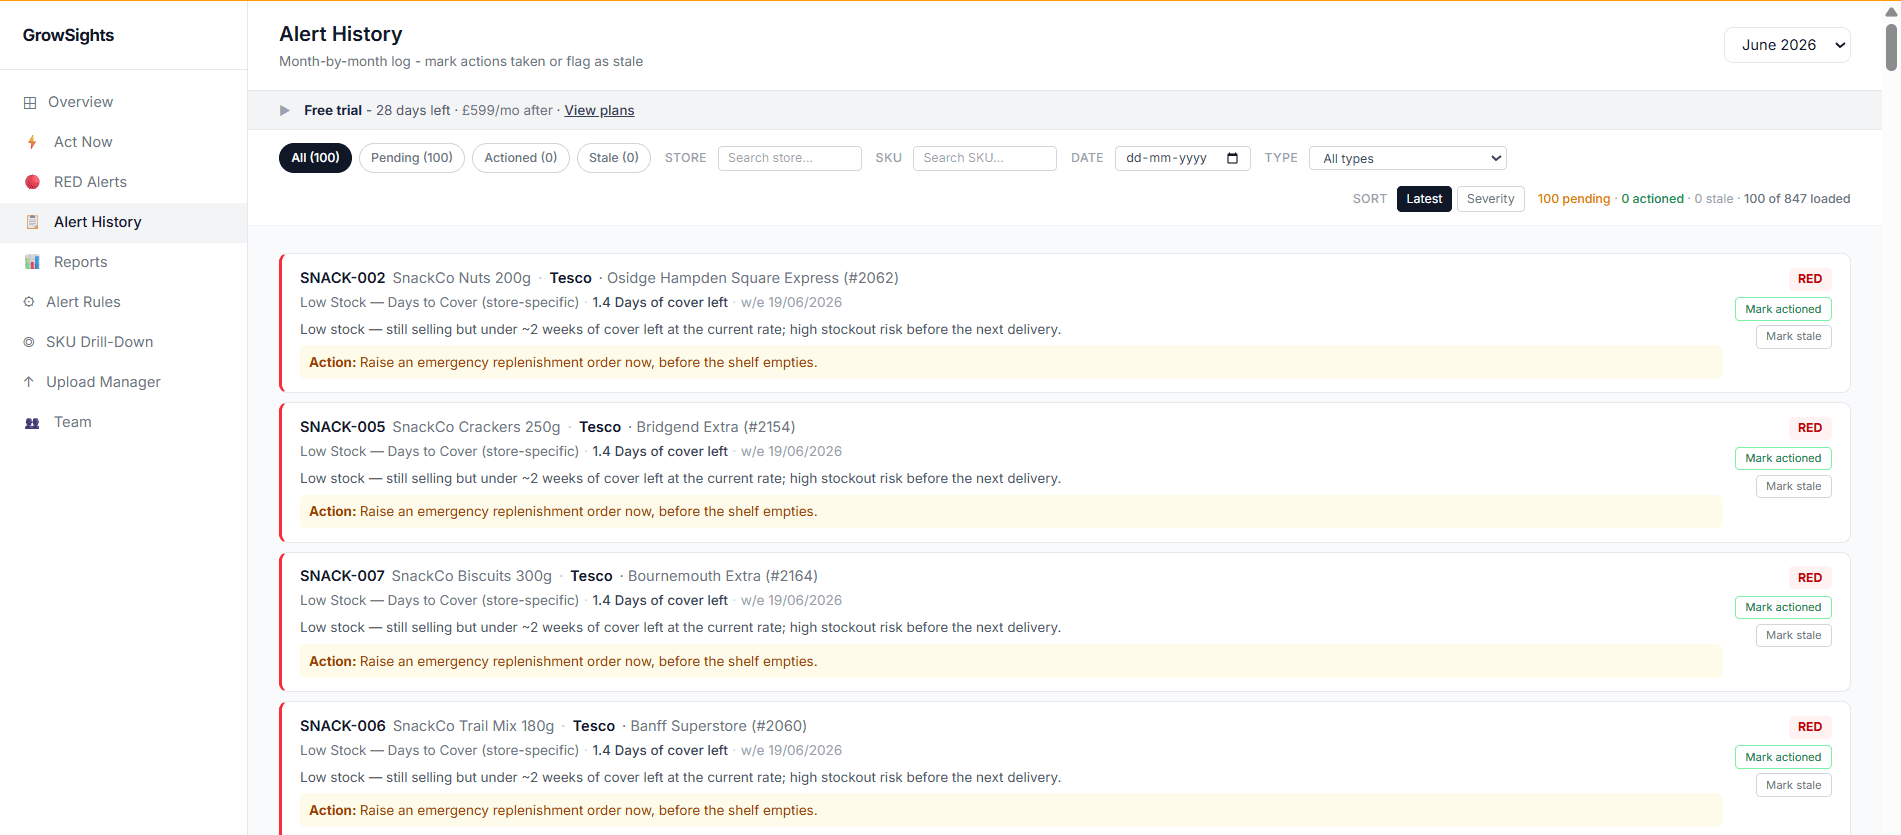
Every alert logged, every action recorded. Track what was actioned, marked stale, or missed - month by month, team-wide. Accountability built in.
Not all stockouts are the same. Stockouts runs a daily 4-signal taxonomy across every SKU × store combination - classifying each failure by type, calculating £/day lost revenue, and scoring severity 0–100.
Shelf genuinely empty for a SKU with real demand. Catches failures early before revenue loss compounds.
Chase store or DC replenishment immediately.
Still selling but running low. The earliest warning signal - catches risk before the shelf empties.
Raise emergency replenishment now, before it runs out.
Stock on hand but stopped selling. Not reaching the shelf. Likely shrink or backroom congestion.
Gap-scan and reset on-hand stock. Route to store systems.
Scorecard looks green but the store sells far below peer benchmarks. Stock stuck in the backroom - the silent killer.
Flag store ops for backroom replenishment and shelf check.
Modern trade tells you what's on the shelf. Quick commerce tells you what's in the dark store. Most brands can only see one - Stockouts is built to see both, on the same four-signal engine.
01
Drop your daily CSV or Excel file into the upload manager. Supports Tesco daily store-level, national weekly, DC-level data, with more retailers added regularly.
02
Stockouts runs its 4-signal taxonomy across every SKU × store combination — classifying each by failure type, calculating £/day lost revenue, and scoring severity 0–100.
03
Ranked alerts appear in the dashboard — worst by revenue first — each with the exact recommended action. Mark actioned or stale to close the loop and track response rate team-wide.
Your initial upload is for preview only. We run the analysis, you see what you're losing - nothing is retained until you choose to go further.
When you start the full pilot, we sign an NDA before any of your data is retained. Your commercial data stays yours.
UK and US delivery. Built to GDPR standards. Your retailer data is never shared or sold.
Every RED Alert ranked by the revenue it's costing you - with the exact action to take. Nothing to build. Ready from week one.
Out of Stock
Highbury Express, London · Premium Vodka 330ml
Chase DC replenishment immediately
£116.60
lost/day
Phantom Inventory
Cardiff Central Express, Cardiff · Premium Vodka 330ml
Gap-scan and reset on-hand stock
£106.14
lost/day
Low Stock (2 days cover)
Preston Fishergate Express, Preston · Premium Vodka 330ml
Raise emergency replenishment now
£82.30
lost/day
Example output from a live Stockouts pilot
NOT READY TO UPLOAD YET?
We'll email it to you when you're ready to try it with your own data.
We'll email you the analysis link. Nothing else.

Certified on Cin7's AI intelligence layer - built to work with the inventory systems your team already runs, not around them.
The first look is free and disposable. The full pilot is where the calibrated system lives.
STEP 1 - FREE
Drop a single retailer CSV. See your initial stockout findings in 10–20 minutes. No sign-up, no NDA, nothing retained.
STEP 2
See your stockouts flagged by type, with a first estimate of daily revenue impact across your SKUs and stores.
STEP 3
Ready to go further? We sign an NDA, then you share 4 weeks of data so we can calibrate the system to your range.
STEP 4
Our team trains Stockouts on your 4 weeks of data, tuning baselines per SKU × store for accurate, relevant alerts.
STEP 5
We walk you through your calibrated dashboard on a demo call. Ranked RED Alerts go live. Revenue recovery starts.
One file. 10–20 minutes. See exactly where you're losing revenue - before you commit to anything.
Free to try. NDA before any data is retained. GDPR compliant.