On-Shelf Availability in UK Grocery: The Complete Guide to Stockouts, Phantom Inventory & Shelf Execution
What mid-market FMCG brands selling through Tesco, Sainsbury's, Asda, Morrisons, Waitrose, and Ocado actually need to know -- and do -- about the availability failures that don't show up in their retailer data.
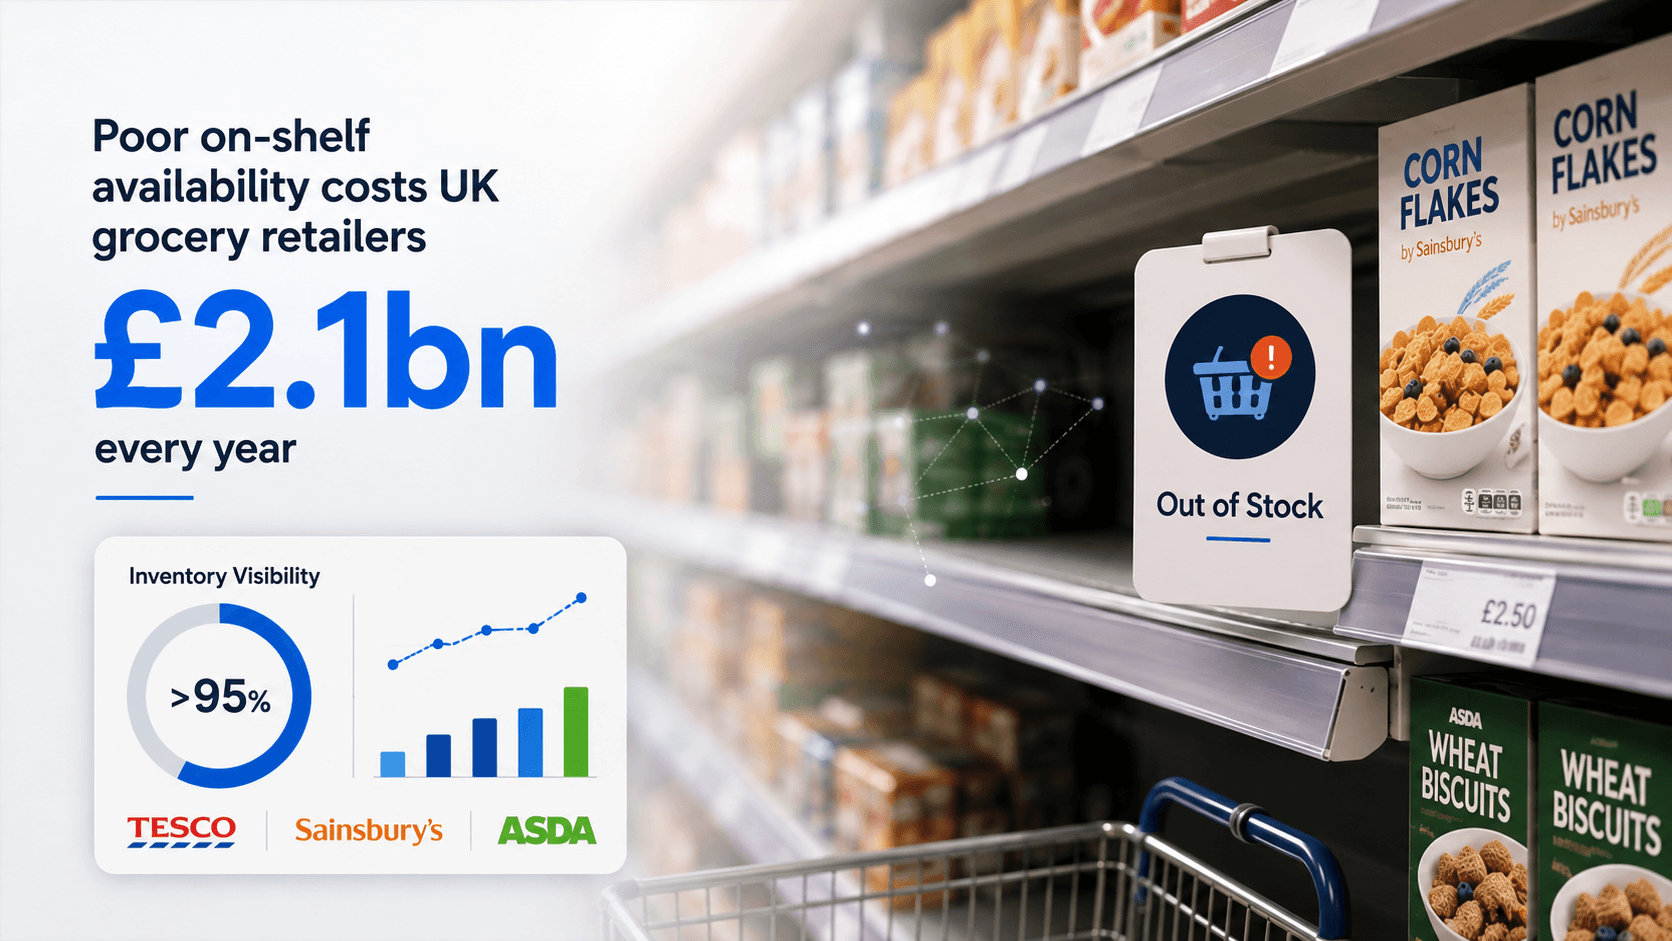
Article summary: Poor on-shelf availability costs UK grocery retailers an estimated £2.1 billion in at-risk sales annually. This guide covers stockouts, phantom inventory, inventory accuracy, shelf depth, planogram compliance, and the data gap between what retailers report and what shoppers find. Includes UK statistics, retailer benchmarks, and brand-side actions your NAM conversation and range review actually need.
There's a gap in most UK retail businesses that nobody talks about in board meetings. It's not in the P&L. It's not visible in your weekly sell-through report. And it's almost certainly not being fixed by the analytics subscription you signed up for last year.
It lives on the shelf. Between what your system says is there, and what your shopper actually finds when they reach for it.
Phantom inventory in UK retail is one of the single most expensive and least measured operational failures most mid-market FMCG brands are ignoring right now. Stockouts. Poor shelf depth. Facing compliance failures. These aren't exciting topics. They don't make headlines the way a new store format or a brand partnership does. But they are, collectively, the most costly problems hiding in plain sight -- and the ones your retailer portal is least likely to tell you about.
This guide explains what each of them actually is, why they happen, what they cost, and -- critically -- what an FMCG brand can actually do about them from the outside.
1. The Scale of the Problem: What UK Retailers Are Losing Right Now
On-shelf availability failures are not a niche operational concern. They are one of the biggest controllable cost centres in UK grocery retail, and most mid-market businesses don't have a reliable number for how much they're losing.
| Problem | Annual UK cost | Source |
|---|---|---|
| Grocery sales at risk from stock gaps | £2.1 billion | Retail Economics / DHL, 2026 |
| Total UK retail shrinkage (theft, damage, errors) | £9 billion | BRC / industry estimates, 2025 |
| Global inventory distortion (out-of-stocks + overstock) | $1.77 trillion | IHL Group, 2025 |
| Average on-shelf availability rate, UK grocery | 89.7% | Retail Economics, 2026 |
| Share of grocery trips with at least one missing item | 1 in 5 | DHL / Retail Economics, 2026 |
| Shoppers who avoid retailers that regularly stock out | 58% | Pricer research, Dec 2025 |
| Shoppers who sometimes leave without buying anything | 42% | Pricer research, Dec 2025 |
That £2.1 billion figure from the 2026 Retail Economics and DHL report is worth pausing on. It's not theoretical. It's based on in-store audits across 100-plus UK locations and a survey of 2,000 households. One in five grocery trips in this country involves at least one missing item -- roughly 930 million shopping visits a year where someone can't find what they came for.
And here's the part that makes it worse: most of those gaps aren't happening because stock doesn't exist. They're happening because something went wrong in the system between "the stock is in the building" and "the product is on the shelf, in front of the shopper."
That something has a name. Actually, it has several.
2. What Is a Stockout -- and Why Is It More Complicated Than It Looks?
A stockout occurs when a product is unavailable for purchase at the point a shopper wants to buy it. It affects an average of 8% of FMCG SKUs at any time, rising to 10% for promoted lines (Brand Allies, 2026). There are four distinct types of stockout, each with a different root cause and a different fix. Most retailers -- and most brands -- treat all four as one problem. That's the first mistake.
The four types of stockout in UK grocery retail
Type 1: True out-of-stock The product doesn't exist anywhere in the store or its supply pipeline. Nothing in the backroom. Nothing ordered. Nothing coming. This is the most obvious type -- and, honestly, the least common in well-run UK grocery operations. Your replenishment system usually catches this eventually.
Type 2: Replenishment failure Stock exists -- somewhere. It's sitting in the backroom, or it arrived at the distribution centre and hasn't moved. But it never made it to the shelf. Either the replenishment trigger didn't fire, the store team didn't get to it, or it's buried under a pallet somewhere. The system thinks everything is fine. The shelf is empty.
Type 3: Phantom inventory The worst of the four. The system says stock is present. It isn't. The replenishment signal never fires because as far as the ERP is concerned, you're fine. You're not. This is the type that's hardest for a brand to detect from outside the retailer's system.
Type 4: Promotional stockout Stock exists in normal quantities. A promotion goes live and demand spikes. Nobody planned for the uplift properly. Within 48 hours, the promoted SKU is gone and won't be back until the next delivery cycle. This is the most predictable stockout there is, and it still happens constantly.
| Stockout type | Root cause | Typical detection time | Brand-side signal |
|---|---|---|---|
| True out-of-stock | Forecast failure, supply disruption | Hours to days | Fill rate drops; reorder visible in portal |
| Replenishment failure | Process gap, backroom management | Days to weeks | Velocity drop with no reorder event |
| Phantom inventory | Data corruption, scan errors, theft | Weeks to months | Velocity decay with normal system stock position |
| Promotional stockout | Demand underforecast | Hours | Velocity spike then cliff-edge drop during mechanic |
Business impact of stockouts UK
Out-of-stocks average around 8% across FMCG categories and rise to 10% for promoted lines. Shoppers switch brands 70% of the time when their product is missing. -- Brand Allies FMCG Compliance Report, 2026
That 70% brand switch rate is the number every FMCG commercial director should have pinned to their wall. When your product isn't there, the shopper doesn't wait. They pick up the competitor's product. And if the competitor's product is good enough -- which most of them are -- a meaningful percentage of those shoppers don't come back.
What a brand can actually do about stockouts
Most of the operational fixes for stockouts live inside the retailer's systems -- cycle counts, replenishment triggers, backroom management. A brand selling into Tesco cannot reach into Tesco's ERP and fix a phantom record. But you can do three things from the outside:
- Monitor velocity at SKU and store level for signs of each stockout type. A velocity drop with no reorder event in the retailer portal is a classic replenishment failure or phantom signal. A velocity cliff mid-promotion is a promotional stockout. These patterns are detectable even from your side of the data wall.
- Raise it with your NAM with evidence, not accusation. "We're seeing a consistent velocity decay on SKU X at your Leeds and Sheffield stores over the past 6 weeks, with no corresponding reorder event -- can you check whether there's a phantom record?" lands very differently to "we think you have a stock problem."
- Use range review data proactively. A buyer will defend their replenishment process. They will not defend velocity data that shows consistent decay patterns clustered around specific stores or regions. Build that case before the range review, not during it.
Key insight for FMCG brands: The industry talks about stockouts as if they're one problem. They're four. The one you can't easily fix is phantom inventory. The one you can prevent is promotional. Start there.
3. What Is Phantom Inventory? The Ghost in Your System
Phantom inventory is when a retailer's ERP records a product as available, but no physical stock exists on the shelf or in the accessible backroom. The replenishment algorithm sees stock on hand and doesn't reorder. The shelf gap persists, silently, and the brand's sell-through data looks normal -- because the phantom record is suppressing both the reorder and the visibility of the gap.
It's not a stockout in the traditional sense. The replenishment system isn't alarmed. The category manager isn't flagging it. The weekly report looks normal. But the shelf is empty, and the ghost of an inventory record is the only thing stopping the reorder from firing.
How phantom inventory happens in practice
A case of product arrives at a Tesco or Sainsbury's store. It gets booked into the system as received. But somewhere between the goods-in bay and the shelf, something goes wrong. Maybe three units get damaged and are discarded without being logged. Maybe two units get stolen. Maybe the case gets put on the wrong bay in the backroom and nobody finds it for a fortnight. The system still shows the full case as available.
Now the replenishment algorithm looks at that SKU and sees stock on hand. It doesn't trigger a reorder. Nobody gets flagged. The shelf gap persists, silently, until someone physically checks the shelf and connects the dots.
According to RELEX Solutions, phantom inventory affects more SKUs in more stores than most retailers realise, and it compounds quickly. The phantom record doesn't just prevent the reorder for that unit. It distorts the forecast for that SKU going forward, misaligns supply and demand across the category, and creates a cycle of reactive fixes that costs far more than the original gap did.
How common is phantom inventory? An honest look at the numbers
The most widely cited figure -- that phantom inventory causes up to 80% of out-of-stock events -- comes from Paul Boyle of Retail Insight, a company that sells phantom inventory detection software, in a December 2023 product announcement. That provenance matters. Retail Insight's commercial interest is in making the problem sound large.
Other sources are more conservative. Appriss Retail's published estimates and independent academic work on inventory accuracy put the phantom contribution to stockouts lower, though estimates vary significantly by retail format, shrinkage rate, and cycle count frequency. No independent body has produced a definitive UK figure.
The honest answer is: nobody knows the real number, and that's precisely the point. If you can't measure it, you can't manage it. The absence of a clean industry figure isn't a reason to dismiss the problem -- it's the strongest argument for getting your own number.
For context: with UK grocery inventory accuracy averaging around 83%, roughly 1 in 6 system records doesn't match physical reality. A meaningful share of those discrepancies will be phantom records. Whether the resulting out-of-stock contribution is 40% or 80%, the operational mechanism is the same and the fix is the same.
Causes of phantom inventory
| Cause | What happens | How common |
|---|---|---|
| Receiving errors | Item scanned incorrectly on arrival, quantity mismatch not caught | Very common |
| Unlogged theft | Product walks out without a system deduction | Common, rising with retail crime |
| Backroom misplacement | Stock in building, not in right location, not triggering picks | Very common |
| Damage without write-off | Damaged units discarded without system update | Common |
| Return without deduction | Customer return processed but not deducted from live stock | Occasional |
| System scan failure | Barcode unreadable, item booked against wrong SKU | Occasional |
| Spoilage not logged | Perishable removed from shelf but not deducted | Fresh departments specifically |
How a brand detects that its retailer has a phantom inventory problem
This is the question most articles on phantom inventory don't answer -- because most are written for retailers, not brands. Here's what to look for from the brand side:
- Velocity decay without a reorder event. If your SKU's sales velocity is declining at a specific retailer but their system still shows stock on hand and no reorder has fired, you're looking at a likely phantom. Pull the sell-through data by store cluster and check whether the decay is consistent or patchy -- patchy decay concentrated in specific stores is a stronger phantom signal.
- Sales velocity lower than distribution-weighted expectations. If your weighted distribution at a retailer is 85% but your actual velocity performance is tracking at 60-65% of what that distribution should deliver, something is wrong between the listing and the shelf. Phantom inventory is one explanation. Facing compression is another. Both are worth investigating.
- Post-promotion cliff. A promotional stockout leaves a signature: velocity spike, then a rapid drop-off that's steeper and faster than typical post-promo decay. This is a different pattern to a phantom but the two can compound -- a phantom on a fast-moving SKU during a promotion is the worst combination.
- Simbe / shelf-scanning data where available. Tesco has been trialling Simbe Robotics' autonomous shelf-scanning system across a number of stores. Where that data is accessible to brand partners, it offers the closest thing to ground truth on shelf state between cycle counts.
What to do when you find it
Once you've built the evidence case, the conversation with your NAM needs to be specific and data-led:
- Bring the velocity decay data by store, not estate-level
- Cross-reference with any store-level replenishment data your portal exposes
- Frame it as a shared problem: "We think we're both losing sales here"
- Ask specifically for a physical check at the flagged stores, or for the retailer to run a targeted cycle count on the affected SKU
- At range review: a documented phantom event with supporting velocity data is grounds for maintaining or increasing distribution, not reducing it
Key insight for FMCG brands: The phantom inventory problem lives inside the retailer's system. But the signal that it exists -- velocity decay that doesn't match expected stock position -- is visible in your data, if you know what to look for.
Most mid-market FMCG brands don't have the tools to distinguish phantom inventory from genuine demand decline. GrowSights' shelf availability diagnostic separates the two -- using your existing sell-through data, no retailer integration required. It takes two weeks and costs nothing to start.
4. Shelf Depth and Facing Count: The Metrics Everyone Forgets
Shelf depth is the number of product units stacked back-to-front behind the front-facing unit. Facing count is how many units are visible side-by-side facing the shopper. Both determine how visible and replenishment-resilient a brand's presence is between delivery cycles -- and both can be below planogram spec without triggering any system alert.
Your product is on the shelf. Technically. There's one facing visible, when the planogram specifies four. There's half a shelf of product where there should be a full shelf. It's not a stockout. The system isn't alarmed. But the shopper walks past it, doesn't register it, and buys something else.
This is the shelf depth and facing count problem. For mid-market FMCG brands selling through the Big Four -- Tesco, Sainsbury's, Asda, Morrisons -- as well as Ocado and Waitrose, it's a daily reality that barely gets measured.
Shelf depth explained
Shelf depth refers to how many units sit behind the front-facing unit on the shelf. As units sell, the product "faces out" and eventually gaps. The shallower the shelf depth, the more frequently you need to replenish -- and the higher the risk of a visible gap between delivery cycles.
Facing count explained
Facing count is how many units of a product are visible side-by-side on the shelf, facing the shopper. More facings means more visual presence, higher shopper pick-up probability, and a bigger buffer before a gap becomes visible. The planogram sets the target facing count for every SKU. The gap between planned and actual facings is where a significant amount of brand sales go missing.
Business impact of facing reduction
Impact of facing reduction on brand visibility:

4 facings (full planogram)  ████████████████  100% visual presence
3 facings                   ████████████      75% visual presence
2 facings                   ████████          50% visual presence
1 facing                    ████              25% visual presence
0 facings (gap)             --                0% -- shopper lost

(GrowSights estimate based on industry facing-compliance benchmarks)
Examples of facing count failure in UK grocery
For FMCG brands, the facing count issue is particularly frustrating because they often can't see it happening. The retailer's portal shows the product as "in range" and "available." It doesn't show you that your four facings at the Tesco Express in Brixton have been compressed to one because a competitor's promotional display took up the space.
This is the kind of gap that independent shelf monitoring and field team verification catch -- and that retailer data doesn't.
Key insight for FMCG brands: Being listed is not the same as being present. Facing count and shelf depth are the difference between a listing that sells and a listing that exists on paper.
5. The Shrinkage Problem: What's Silently Creating Phantom Records
Retail shrinkage -- the loss of stock through theft, damage, administrative error, and supplier shortfalls -- doesn't just cost the retailer the unit. Every unlogged shrinkage event creates a phantom inventory record that corrupts replenishment data downstream. UK shrinkage is estimated at £9 billion annually across all retail channels (BRC / industry estimates, 2025).
Most mid-market retailers are underestimating both its scale and its composition. A note on the data: shrinkage breakdowns by cause vary significantly between UK and US survey methodologies. The BRC's own figures focus on external theft as the dominant headline -- customer theft accounts for £2.2 billion of the £4.2 billion total crime cost in the BRC's 2025 Crime Survey, with organised retail crime called out as the dominant and growing driver. Internal theft figures are harder to verify independently.
What the BRC data does confirm clearly: the problem is large, growing, and heavily shaped by organised criminal networks systematically targeting store estates -- a pattern that creates waves of phantom inventory across multiple locations simultaneously.
How shrinkage creates phantom inventory
Beyond the direct cost of lost stock, shrinkage has a second-order effect that gets far less attention: it creates phantom inventory. Every item stolen and not logged, every unit damaged and thrown away without a system update, every delivery discrepancy that slips past goods-in -- all of it becomes a ghost record. The system holds the value and shows the unit as available. The shelf doesn't.
Shrinkage event occurs (theft, damage, error)
         ↓
Item leaves the building (or can't be sold)
         ↓
System record NOT updated
         ↓
Ghost record created -- phantom inventory
         ↓
Replenishment not triggered
         ↓
Shelf gap accumulates, silently
         ↓
Sales lost without any system signal
         ↓
Forecast corrupted by apparent "low demand"
         ↓
Future orders reduced for a product that's actually selling fine
Each step in that chain costs money. The shrinkage event is just the first bill. The phantom record that follows is the one that keeps arriving, quietly, week after week.
What organised retail crime means for FMCG brands specifically
The organised crime pattern identified by the BRC has a specific implication for FMCG brands: targeted product categories get hit across multiple stores in a coordinated way. If your SKU is in a category being targeted -- health and beauty, ambient grocery, confectionery -- you may see velocity decay clustered across stores in the same region or retail chain at the same time. This is not a phantom inventory pattern from ordinary process failures. It's a phantom pattern driven by systematic external theft, and it requires a different conversation with your NAM -- one framed around loss prevention data, not replenishment.
Prevention and best practice
- Connect loss prevention and inventory management systems. Every logged theft or damage incident should trigger an automatic SKU-level stock deduction.
- Train store teams to log damage and discard events at unit level, not just as a category write-off.
- Use retail analytics to flag SKUs where sales velocity has dropped sharply but system stock position hasn't changed -- a reliable signal of unlogged shrinkage.
Key insight for FMCG brands: Shrinkage isn't just a retailer's loss prevention problem. For brands, the relevant question is whether organised or repeated shrinkage on your SKUs is creating phantom records that are suppressing your velocity data -- and whether you can detect the pattern before your next range review.
6. Overstock: The Other Side of the Availability Coin
Overstock occurs when a retailer holds more of a product than current demand justifies -- tying up working capital, wasting shelf space, and in perishable categories, leading directly to write-offs. It is the mirror problem of phantom inventory, and both are caused by the same root failure: inventory data that doesn't reflect demand reality.
Most of this article is about products being missing. But availability failures cut both ways. Overstocking ties up cash that could be invested elsewhere, takes up shelf space that should be allocated to faster-moving SKUs, and in perishable categories leads directly to wastage and write-offs.
Business impact of overstock
| Overstock consequence | Financial impact |
|---|---|
| Working capital tied up in slow stock | Cash flow strain; opportunity cost of inventory |
| Shelf space misallocated to slow SKUs | Opportunity cost; fast-movers can't get facing |
| Perishable write-offs (fresh, chilled) | Direct loss: cost of goods plus handling |
| Markdown and promotional clearance costs | Margin erosion to move excess stock |
| Supplier relationship pressure | Brands pushed on overstock claims; chargebacks risk |
The overstock-stockout paradox
Overstock and stockout often happen simultaneously in the same store. Certain SKUs are over-ordered and sitting in the backroom. Others are running dry and not being replenished. The category manager sees neither clearly because the data isn't granular enough, fast enough, or honest enough about what's actually on the shelf versus what's in the system.
"The retailers who outperformed in 2025 shared a common trait: they anticipated demand shifts rather than merely reacting to them." -- Assosia UK Grocery Retail Trends 2026
Key insight for FMCG brands: Overstock on your SKU at a retailer can be as damaging as a stockout. A retailer sitting on excess stock will reduce your next order, compress your facings to make room, and potentially delist ahead of range review. Monitor your days cover figures where your portal exposes them.
7. On-Shelf Availability: The Metric That Ties Everything Together
On-shelf availability (OSA) measures whether a product is physically present and purchasable on the shelf when a shopper wants to buy it. It is the single KPI that captures stockouts, phantom inventory, facing gaps, and replenishment failures in one number. The UK grocery sector average is 89.7%, according to the 2026 Retail Economics and DHL report -- a time-weighted measure across all SKUs, meaning fast-movers typically perform better and tail SKUs worse.
The 2026 Retail Economics and DHL report puts UK grocery OSA at 89.7% on average. That sounds high. It isn't.
With one in five grocery trips involving at least one missing item, the commercial stakes are clear. The BRC's own data on shopper switching rates -- roughly 70% of shoppers switch brands, not just stores, when their item is missing (Brand Allies, 2026) -- makes this a brand problem as much as a retailer problem.
On-shelf availability benchmarks by UK retailer
Ocado (online, automated DC)    ██████████████████████████████████████  ~99%
Tesco (Big Four)                 █████████████████████████████████        ~90%
Sainsbury's                      █████████████████████████████████        ~88%
Waitrose                         ████████████████████████████████         ~87%
Asda                             ████████████████████████████████         ~85%
Value grocery / independent      ██████████████████████████               ~65-75%
GrowSights estimates based on Retail Economics 2026, BRC data, and industry benchmarks. These are averages across full estate and all SKU types.
The gap between Ocado's near-perfect availability and the independent grocery sector's 65-75% estimate tells you everything about how OSA varies by retail format and inventory sophistication. Ocado runs a highly automated distribution centre. An independent grocery chain runs individual human processes at every store -- each one a potential failure point.
Why shopper expectations are raising the bar
86% of UK shoppers now say they expect core grocery items to be available every time they visit, according to Pricer's December 2025 research. The shopper tolerance for gaps is declining. The sophistication of most mid-market grocery operations' availability tracking is not keeping pace.
8. How Inventory Accuracy Sits Underneath Everything
Inventory accuracy is the percentage of system stock records that match physical reality in-store. The UK grocery industry average sits at approximately 83% (Retail Insight analysis). At that level, roughly 1 in 6 inventory records doesn't reflect what's physically on the shelf -- making every downstream metric (stockout rate, fill rate, forecast accuracy) less reliable than it appears.
Inventory accuracy is calculated as: (Accurate inventory records / Total inventory records) x 100. If your system says you have 100 units of SKU X across your estate and you physically have 87, your accuracy is 87%. The 13 ghost units are generating false signals, suppressing reorders, and distorting your forecast.
Inventory accuracy tiers and their operational impact
| Inventory accuracy level | Operational impact |
|---|---|
| 95%+ (high performing) | Replenishment reliable; phantom inventory minimal; forecasts credible |
| 88–95% (average, Big Four) | Moderate phantom inventory; some forecast noise; manageable |
| 80–88% (below average) | Significant phantom inventory; replenishment unreliable; losing sales silently |
| Below 80% (independent / value grocery) | Structural availability failure; high shrinkage; forecast essentially broken |
Why inventory accuracy degrades continuously
Inventory accuracy isn't static. It degrades every day. Every delivery, every sale, every return, every theft, every damage event -- all are opportunities for the system record to drift from physical reality. Without active correction through cycle counts, automated reconciliation, or real-time monitoring, accuracy is getting worse, not staying the same.
"Phantom inventory persists because errors are only caught after they've already happened. This is a systemic failure, and it can't be fixed by manual correction or an isolated audit exercise." -- RELEX Solutions, July 2026
What a brand should ask at range review
You cannot control your retailer's inventory accuracy. But you can ask about it -- and frame it as a shared commercial interest:
- "What's your cycle count frequency for this category at these stores?" -- a retailer counting weekly is fundamentally different from one counting quarterly.
- "Can you confirm the last physical count for SKU X at store Y?" -- if the answer is vague, that's informative.
- "We're seeing velocity decay at these stores that doesn't correspond with any reorder event -- can you cross-check against the last physical count?" -- this is the cleanest way to surface a phantom without it sounding adversarial.
The goal isn't to embarrass the buyer. It's to establish that your velocity data reflects a system problem, not a demand problem.
9. The Loyalty Impact: What Availability Failures Do to Your Customer Relationship
Availability failures don't just cost you the sale that didn't happen -- they cost you the shopper who decides, consciously or not, that they can't rely on your brand. Research shows 58% of UK shoppers actively avoid retailers that are regularly out of stock, and 70% switch to a competitor brand when their preferred product is missing (Brand Allies, 2026).
The Pricer research published in December 2025 is worth working through in detail:
- 86% of UK shoppers expect core grocery items to be available every visit
- 67% are more loyal to stores with consistently well-stocked shelves
- 58% actively avoid retailers that are regularly out of stock
- 42% sometimes leave without buying anything when items are missing
- Among high-income households (£125k+), 68% abandon their shop due to stockouts
The loyalty cascade from a single stockout event
Your highest-value shoppers are the most intolerant of availability failures. If your product is missing at the premium grocery tier -- Waitrose, Ocado, Sainsbury's Taste the Difference -- the shopper who would have spent £6 on your sauce instead spends it on a competitor and walks out satisfied with an alternative.
The loyalty cascade from a stockout event:

Shopper can't find product
         ↓
36% buy elsewhere or don't buy at all (no sale)
         ↓
70% switch to a competitor brand within the same store
         ↓
~30% of switchers don't return to original brand on next visit
         ↓
Habit begins to form around competitor
         ↓
Repeat purchase lost (compounding over months)
         ↓
FMCG brand sees "declining velocity" in data
         ↓
Retailer reduces shelf space based on lower velocity
         ↓
Fewer facings = more frequent gaps = more loyalty loss

(GrowSights analysis, sourced from Brand Allies 2026, Pricer 2025, AlixPartners 2024)
This is the death spiral that phantom inventory and stockouts create for mid-market FMCG brands. And most of them never see it coming in their data because the data is telling them the product is available.
Key insight for FMCG brands: The financial cost of an availability failure is not the one sale that didn't happen. It's the cumulative loyalty erosion that compounds over the weeks and months that follow.
10. Planogram Compliance and Category Management
Planogram compliance measures whether products are positioned on the shelf exactly as specified in the retailer's planogram -- the visual blueprint that defines which products go where, at what shelf height, with how many facings. For FMCG brands, non-compliance means trade spend is wasted and facing count is below what was agreed -- without any alert being raised in the retailer's system.
What is a planogram?
A planogram is the retailer's visual blueprint for a section of shelf: which products go where, in what order, with how many facings, at what height, and in what fixture position. For brands, planogram compliance is the bridge between being listed and actually being present as intended.
Causes of planogram compliance failure
When planogram compliance breaks down -- which it does constantly in high-footfall stores with stretched replenishment teams -- the shelf looks nothing like what the retailer agreed. Products get shifted, compressed, replaced by promotional materials, or pushed aside during restocking.
"Whether a brand's secondary display is live, correctly stocked, and in the agreed position -- end-caps are premium real estate. Brands pay significant trade spend for them, but without verification, there's no guarantee they appear as planned." -- Brand Allies UK FMCG Compliance Report, 2026
For brands paying for end-cap displays or branded bays at Tesco or Sainsbury's, planogram non-compliance is trade spend burnt without return. You're paying for four facings at eye level and getting two facings at shin height, and nobody told you.
HFSS regulations and planogram compliance (post-October 2025)
The HFSS (High Fat, Salt, and Sugar) placement regulations that came into full force in October 2025 add a compliance layer on top. Brands in affected categories now navigate both planogram compliance and regulatory compliance simultaneously -- in stores where shelf resets happen imperfectly and verification is manual at best.
| Planogram compliance issue | Frequency | Impact on brand |
|---|---|---|
| Facing count below plan | Very common | Lower visibility, lower pick-up rate |
| Product at wrong shelf height | Common | Below eye-level = significantly lower conversion |
| Promotional display not executed | Common | Trade spend wasted; no sales uplift |
| Incorrect adjacency | Occasional | Shopper navigation failure; cross-sell lost |
| HFSS non-compliant placement | Post-Oct 2025: regulatory risk | CMA enforcement risk; reputational exposure |
Best practice for planogram compliance
- Build facing count verification into every field team store visit as a non-negotiable task.
- Use retail execution monitoring to catch compliance gaps between field visits, not just during them.
- Cross-reference planogram compliance data with sell-through data at SKU level to identify stores where compliance failures are suppressing velocity.
Key insight for FMCG brands: A listing agreement tells you where your product should be. It doesn't tell you where it actually is. Treat planogram verification as part of your trade investment accountability, not as an afterthought.
11. The Data Gap: Why Mid-Market FMCG Brands Can't See the Problem
The core data problem for mid-market FMCG brands in UK grocery: retailer data shows system state, not shelf state. Sell-through reports, portal data, and CSV exports all reflect what the system recorded -- not what the shopper found when they reached for your product.
Tesco Connect, Sainsbury's Nectar360, Asda's supplier portal -- these platforms share sell-through data, stock information, and replenishment signals. But they share what the system says. Not what the shelf looks like.
What retailer data shows -- and what it hides
The data your retailer sends you tells you what was scanned at a till. It does not tell you that your product has been phantom at the Morrisons in Leeds for 11 days because two units walked out and weren't logged. It shows you apparently normal velocity -- because the phantom record is suppressing the reorder -- until the situation gets so bad that the physical count finally catches up with reality.
| Data source | What it tells you | What it doesn't tell you |
|---|---|---|
| Retailer sell-through reports | Units scanned at POS | Phantom inventory, backroom stock, facing count |
| Retailer supplier portal | Replenishment status, orders | Actual shelf state, planogram compliance |
| Weekly CSV exports | Historical sales velocity | Real-time gaps, promotional compliance |
| Field team audit | Point-in-time shelf truth | What happens between visits |
| Real-time availability intelligence | Continuous shelf-state signal | (Nothing -- this is the complete picture) |
What retailers are doing about it: Tesco's Simbe shelf-scanning trial
It's worth noting that retailers themselves are investing in closing this gap. Tesco has been trialling autonomous shelf-scanning technology from Simbe Robotics across a number of stores -- robots that traverse aisles and capture real-time shelf state data, flagging gaps, misplacements, and facing count deviations. This is exactly the kind of ground-truth data that bridges the gap between ERP records and physical reality.
Where Simbe data becomes accessible to brand partners, it offers something genuinely new: shelf state intelligence between manual audits and cycle counts. For brands, the question is whether your retailer relationship is senior enough to access it, and whether it becomes a standard supplier intelligence tool or remains proprietary.
This is the data gap at the heart of mid-market FMCG brand growth challenges in UK grocery. The retailer's data is a proxy for system state. It's not a proxy for shelf state. Building independent retail analytics capability isn't a luxury for mid-market brands. It's the only way to see what's happening to your product between the retailer's reports.
Key insight for FMCG brands: If your only availability intelligence is your retailer's data portal, you're navigating with a map drawn last week. Ask your NAM about cycle count frequency, Simbe access, and store-level stock visibility. The answer tells you a lot about where your blind spots are.
12. Comparing How the Big Four Handle Availability
The environment your brand operates in shapes how large your availability risk is. Here's an honest assessment by retailer.
| Retailer | OSA estimate | Inventory accuracy | Phantom inventory detection | Supplier data access |
|---|---|---|---|---|
| Tesco | ~90% | High (~90%) | Cycle counts + Simbe shelf-scanning trial | Tesco Connect (partial) |
| Sainsbury's | ~88% | High (~88%) | Category-level monitoring | Nectar360 |
| Asda | ~85% | Medium (~85%) | Improving with tech investment | Limited |
| Ocado | ~99% | Very high (automated DC) | Algorithm-driven | Strong |
| Waitrose | ~87% | High (~87%) | Store manager driven | Limited |
| Morrisons | ~84% | Medium (~83%) | Cycle count dependent | Moderate |
| Independent / value grocery | ~65–75% | Low (estimated) | Manual audit only | None |
GrowSights estimates based on Retail Economics 2026, BRC data, and industry benchmarks. OSA and accuracy figures are estate averages.
For mid-market FMCG brands whose retail strategy spans the full grocery tier, the availability intelligence challenge compounds rapidly. Every retailer has different data quality, different cycle count frequency, and different levels of supplier visibility. The retailers with the lowest accuracy -- independent and value grocery -- are also the ones where your brand has the least portal access.
Chart: UK grocery market share (2025 estimates, Kantar)
Tesco          ██████████████████████████████  ~28.5%
Sainsbury's    ████████████████████            ~15.2%
Asda           ████████████████                ~12.9%
Morrisons      ███████████                     ~9.1%
Aldi           ██████████                      ~11.0%
Lidl           ████████                        ~7.7%
Ocado          ████                            ~1.8%
Waitrose       █████                           ~4.4%
Others         ████                            ~9.4%
If you're working through the SaaS stack costs involved in building availability intelligence across multiple retailer environments, that piece is worth reading before committing to a tooling decision.
13. What Good Looks Like: Building Real Availability Intelligence as an FMCG Brand
The brands with the most resilient availability operations share a few characteristics. They're not necessarily the biggest. They're the ones who've built the right processes and -- critically -- have learned to act on signals from outside their retailer's data layer.
They monitor velocity by SKU and store, not just by retailer. Estate-level velocity data conceals store-level phantom patterns. The brand that spots a velocity decay concentrated in three Leeds stores and raises it with the NAM in week 3 gets the issue fixed. The brand that waits for the estate-level quarterly report gets it flagged at range review -- after the damage is done.
They've built promotional uplift into their supply plan, not their reaction. Promotional stockouts are the most preventable availability failure. Before every major promotion: what's the demand uplift assumption, what's the safety stock buffer, who owns the reorder trigger if stock runs low in the first 48 hours. These questions should have named answers before the promotion goes live.
They use field visits as data collection, not just relationship management. A field visit that captures facing count, shelf depth, planogram compliance, and competitor positioning by store is a different asset to one that captures impressions. Digitise it. Feed it back into your SKU-level performance view.
They treat the NAM conversation as a data exchange, not a negotiation. The brands that maintain or grow distribution through range reviews are the ones that walk in with evidence. Velocity by store cluster. Documented phantom events. Planogram compliance gaps cross-referenced with velocity suppression. This is not the conversation most mid-market brands are having -- which is exactly why the ones who are having it stand out.
They act on Thursday, not the following Monday. The difference between a reactive and proactive availability operation is speed. A problem flagged on Monday from data collected last Friday gets fixed next week. A problem detected in near-real-time gets fixed today. The operational lever is the same. The lag is what makes the difference.
This is the principle behind GrowSights' approach. Not dashboards. Decision signals that reach the right person fast enough to act -- specifically built for the mid-market brand that doesn't have a team of 40 analysts and can't wait for the retailer's weekly batch report.
Actionable Recommendations
For FMCG Brand CEOs and Commercial Directors
- Know your phantom inventory exposure by retailer. Which of your retail partners has the lowest inventory accuracy and the least frequent cycle counts? That's where your hidden availability gap is largest. Prioritise intelligence investment there first.
- Build a velocity monitoring discipline at SKU and store level, not estate level. The signal you need to catch a phantom before it becomes a range review problem lives at store cluster granularity, not in the weekly sell-through aggregate.
- Set a minimum of one field verification visit per quarter per key retailer cluster, specifically checking facing count and planogram compliance -- not just a relationship call. If your top 10 stores show 80% facing compliance on average, you're losing meaningful sales every week.
- Before every major promotion: confirm stock availability by store, not just by retailer DC. A promotional allocation that's confirmed at DC level but hasn't been picked and moved to shelf by day one is a promotional stockout waiting to happen.
- At range review: bring velocity data by store cluster, not just estate totals. A consistent velocity decay pattern concentrated in specific stores is evidence of a system problem, not a demand problem. Present it that way.
For Supply Chain and S&OP Leaders
- Add phantom inventory detection as a standing agenda item in your S&OP process. It's not a one-time problem -- it accumulates continuously and needs continuous measurement, not a quarterly audit.
- Model the gap between system-recorded stock and physical reality for your most important SKUs by retailer. Use historical sell-through data and velocity decay patterns to identify where drift is most likely.
- Build a promotional availability playbook. Before every major promotion, name the demand uplift assumption, the safety stock buffer, and the person who owns the reorder trigger if stock runs low in the first 48 hours.
- Where your retailer allows real-time data feeds rather than batch exports, use them. Every day of lag in availability data is another day of phantom inventory accumulating without a signal.
- Integrate loss prevention signals into your availability monitoring. If your retail partner is running organised crime events in specific store clusters, the velocity decay pattern will look different to ordinary phantom inventory. Learn to distinguish the two.
Build Availability Into Your Commercial Advantage
The brands winning in UK grocery right now aren't winning because they have better products or bigger marketing budgets. They're winning because they know -- reliably, quickly -- where their product is and isn't at any given moment. And they have a mechanism to act on that information before the shopper finds the gap.
At GrowSights, we work with mid-market FMCG brands selling through UK grocery retailers to build that intelligence layer. We diagnose availability failures, surface phantom inventory signals from existing sell-through data, and build the evidence base that brands need for productive NAM conversations and range reviews -- without requiring a retailer system integration.
If you sell through Tesco, Sainsbury's, Asda, Ocado, Waitrose, or Morrisons and you're not certain about your on-shelf performance right now, that uncertainty is costing you money. Find out how much at growsights.co.uk/start-a-conversation.
You can also explore who we work with and how our diagnostic process works.
FAQ: Phantom Inventory, Stockouts & Shelf Availability in UK Retail
What is phantom inventory?
Phantom inventory is when a retailer's inventory management system records a product as available in stock, but no physical stock exists on the shelf or in accessible backroom locations. Because the system believes the product is there, no replenishment order is triggered. The shelf gap persists without any system alert -- and the brand's sell-through data continues to look normal, because the phantom record suppresses both the reorder and the visibility of the gap.
What causes phantom inventory?
The most common causes are receiving errors (products incorrectly scanned at goods-in), unlogged theft (products stolen without a system deduction), backroom misplacement (stock in the store but in the wrong location), damage that isn't written off in the system, customer returns that aren't properly deducted, and spoilage that isn't logged. Each creates a gap between what the system records and what physically exists on the shelf.
What is the difference between phantom inventory and a stockout?
A stockout is any situation where a product is unavailable to a shopper who wants it. Phantom inventory is a specific type of stockout where the system incorrectly believes stock is present, suppressing the replenishment order and making the gap invisible in the data. A true stockout triggers a replenishment signal. A phantom inventory event doesn't -- which is what makes it the most costly and hardest to detect of the four stockout types.
What is on-shelf availability?
On-shelf availability (OSA) is the percentage of time a product is physically present on the shelf and available for purchase when a shopper wants it. It is the master KPI for retail availability, capturing stockouts, phantom inventory, and replenishment failures in a single number. The UK grocery sector average is 89.7%, according to the 2026 Retail Economics and DHL report -- a time-weighted average across all SKUs, with fast-movers typically performing better and tail SKUs worse.
How is inventory accuracy calculated?
Inventory accuracy is calculated as: (Number of accurate inventory records / Total inventory records) x 100. An accurate record is one where the system count matches the physical count for a given SKU at a given location. The UK grocery industry average sits at approximately 83% (Retail Insight analysis). High-performing retailers achieve 95% or above.
What is shelf depth in retail?
Shelf depth refers to the number of product units stacked back-to-front behind the front-facing unit on a shelf. A shallow shelf depth means the shelf gaps quickly as units sell, requiring more frequent replenishment and increasing the risk of a visible gap between delivery cycles. Shelf depth is set by the planogram and is one of the key metrics that separates brands with resilient shelf presence from those that gap frequently.
What is planogram compliance?
Planogram compliance is the degree to which products are positioned on the shelf in accordance with the retailer's planogram -- the specification that defines which products go where, at what height, with how many facings, and in what order. Poor planogram compliance means brands may be paying for premium shelf positions they're not occupying and operating with facing counts below what was agreed, without any system alert being raised.
How can an FMCG brand detect phantom inventory at its retailers?
A brand cannot access the retailer's ERP directly. But phantom inventory leaves detectable signals in sell-through data: velocity decay at specific stores without a corresponding reorder event in the retailer portal; sales velocity significantly below what distribution-weighted expectations suggest; and post-promotion cliff patterns that are steeper than typical decay. Building a store-level velocity monitoring capability -- rather than relying on estate-level aggregates -- is the practical first step. Where Tesco's Simbe shelf-scanning data becomes accessible to brand partners, it offers the closest available ground truth on shelf state.
How does shrinkage create phantom inventory?
When a product is stolen, damaged, or discarded without the system being updated, the unit leaves the physical store but remains as an available record in the ERP. This ghost record suppresses the replenishment trigger, leaving the shelf empty without any operational signal. Organised retail crime creates this effect at scale -- coordinated theft across multiple stores in the same estate generates wave-pattern phantom inventory that looks like unusual velocity decay rather than a system failure.
What is the cost of poor on-shelf availability in UK grocery?
According to the 2026 Retail Economics and DHL report, poor on-shelf availability puts £2.1 billion of UK grocery sales at risk annually. One in five grocery trips involves at least one missing item. UK retail shrinkage -- a major driver of phantom inventory -- is estimated at approximately £9 billion annually across all retail channels (BRC and industry estimates, 2025). The global figure for inventory distortion (out-of-stocks plus overstock combined) is $1.77 trillion, according to IHL Group (2025).
Research sources:
- Retail Economics / DHL: The Availability Effect Report 2026 -- on-shelf availability, £2.1bn at-risk sales figure
- Pricer Research, December 2025 -- UK shopper stockout behaviour: availability expectations, basket abandonment, loyalty switching
- BRC Crime Survey 2025 -- UK customer theft figures, organised retail crime, total crime cost £4.2bn
- BRC / industry estimates -- total UK retail shrinkage £9bn, 2025
- RELEX Solutions, July 2026 -- phantom inventory causes, systemic nature, detection approaches
- Retail Insight / Paul Boyle / Grocery Trader, December 2023 -- phantom inventory vendor estimate (up to 80% of stockouts); note: vendor-sourced figure, no independent UK equivalent available
- Brand Allies UK FMCG Compliance Report, 2026 -- stockout rates 8% (10% promoted), 70% brand switch rate, facing count gaps, planogram compliance, HFSS regulations
- IHL Group, 2025 -- global inventory distortion $1.77 trillion
- Kantar UK grocery market share data, 2025
- Assosia UK Grocery Retail Trends 2026 -- predictive capability and demand anticipation
- Tesco / Simbe Robotics shelf-scanning trial -- publicly reported, 2025/26
- AlixPartners 2024 -- shopper switching and repeat purchase attrition rates
- GrowSights estimates -- OSA and inventory accuracy benchmarks by retailer; facing count impact model; loyalty cascade model
Published by GrowSights | Retail Intelligence and Growth Engineering | Point of View