On-Shelf Availability: The KPI Missing From Your NAM's Scorecard
Your National Account Manager knows every number on their scorecard cold. Ask them about the one that isn't there - and the silence will cost you.
There's a question you can ask your NAM that will tell you more about your commercial operation than a full quarter's review deck.
Don't ask about volume. Don't ask about distribution gains or JBP status or how the last promo performed. Ask them this: what's our avoidable stockout loss running at right now, across Tesco, Asda and Sainsbury's?
Most will pause. A few will guess. Almost none will have an actual number.
That pause is the whole problem. Not because your NAM is bad at their job. Because nobody ever asked them to track it, bonused them on it, or gave them the data to see it. And while that gap sits untracked, a quiet, consistent loss of 5-8% of your addressable sales drains out of the business every single week, with no owner, no target, and no quarterly review.
This article covers what's on the standard NAM scorecard, why on-shelf availability is the line that's been missing from it for years, why recovering that loss is structurally cheaper than every other growth lever available to you, and what poor availability quietly does to your position at range review.
1. The Scale of the Problem: £2.1 Billion and Counting
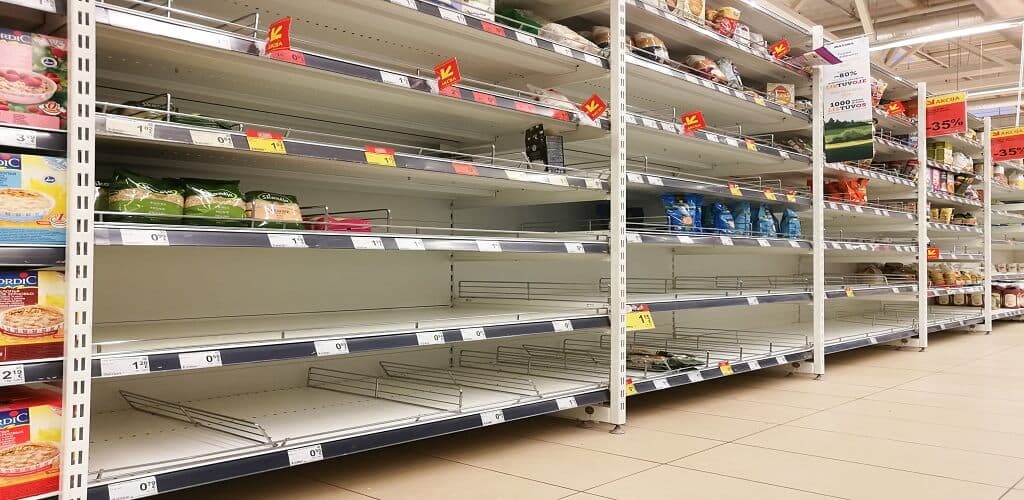
Before we get into scorecards and metrics, it's worth understanding what's actually happening on UK grocery shelves right now.
| Metric | Figure | Source |
|---|---|---|
| Average UK grocery on-shelf availability rate | 89.7% | Retail Economics / DHL, 2026 |
| Effective availability (with substitutes included) | 97.1% | Retail Economics / DHL, 2026 |
| Annual grocery sales at risk from stock gaps | £2.1 billion | Retail Economics / DHL, 2026 |
| Annual shopping trips involving at least one out-of-stock | ~930 million | Retail Economics / DHL, 2026 |
| Proportion of grocery trips with at least one missing item | 1 in 5 | Retail Economics / DHL, 2026 |
| Stores with at least one item missing from a typical weekly shop | 82% | Retail Economics / DHL, 2026 |
| Stores recording two or more missing items per shop | 64% | Retail Economics / DHL, 2026 |
Those figures come from a national audit conducted across 100+ UK store locations, surveying 2,000 households and covering a cross-section of retailers, formats and regions. They're not industry estimates. They're what actually happens when you walk the aisles.
The headline number - 89.7% - sounds high until you do the maths. A 10.3% availability gap across UK grocery translates to £2.1 billion of sales that were either lost outright or displaced to a competitor because a shopper couldn't find what they came for. And that number doesn't capture the damage to loyalty, future purchase frequency, or the longer-term switching risk that follows a stockout at the wrong moment.
For FMCG suppliers, the number that matters most isn't the sector average. It's your number, on your SKUs, in your stores. And for most suppliers, that figure sits in the 5-8% avoidable loss range. Quietly. Every week.
Key insight: 82% of UK stores had at least one item missing from a typical weekly shop in 2026 audits. If your SKU is part of that gap, the retailer's system often won't know - and neither will your NAM.
2. What's Actually on the NAM Scorecard
Every FMCG supplier reviewing their account team each quarter is working from roughly the same set of measures. These haven't changed much in twenty years, because they work. They're tied to what NAMs are bonused on, and they cover the commercial moves that drive visible growth.
Here's what the standard scorecard looks like:
| KPI | What It Measures | Review Cadence | Typically Bonused? |
|---|---|---|---|
| Sales value vs. plan | Top-line delivery against the agreed number | Weekly / Monthly | Yes - core bonus driver |
| Sales volume vs. plan | Unit throughput against target | Weekly / Monthly | Yes |
| Distribution | SKUs listed, stores ranged | Monthly | Yes - key growth lever |
| Promotional ROI | Trade spend efficiency per event | Post-promo + quarterly | Sometimes |
| Waste percentage | Product written off | Monthly | Occasionally |
| Forecast accuracy | Demand plan vs. actual shipments | Weekly | Occasionally |
| JBP milestone delivery | Progress against joint business plan | Quarterly | Yes - at senior NAM level |
| New listings / NPD | SKUs gained into distribution | Rolling | Yes |
This list isn't random. It's built around the things a NAM can directly move - distribution gained, volume shipped, promotions negotiated. They're the right things to measure for the growth levers a NAM controls.
But look closely, and there's a gap.
None of these lines tells you whether the products that are already listed, already ordered, and already shipped are actually reaching the shelf in a state a shopper can buy them.
The standard scorecard answers: "Are we growing?" It doesn't answer: "Are we collecting the growth we've already paid for?"
That's the hole. And it costs between 5% and 8% of addressable sales for the average FMCG supplier across UK grocery - year in, year out, without a line on any scorecard tracking it.
📊 Chart: Typical NAM Scorecard - Coverage vs. Availability Gap
What the scorecard tracks vs. what it misses:

Sales vs. plan         ██████████████████████████████  (tracked)
Distribution           ██████████████████████████████  (tracked)
Promotional ROI        ██████████████████████████████  (tracked)
Waste %                ██████████████████████████████  (tracked)
Forecast accuracy      ██████████████████████████████  (tracked)
Avoidable stockout loss ░░░░░░░░░░░░░░░░░░░░░░░░░░░░░  (not tracked)
The only untracked metric is also the only one measuring growth the supplier already paid for and hasn't collected.
3. The Number That's Missing: Avoidable Stockout Loss Defined
On-shelf availability (OSA) is the percentage of time a product a shopper wants is physically present and purchasable on the shelf when they look for it. That distinction - physical presence, purchasable - matters more than it sounds.
The "avoidable" part is what makes this a commercial metric rather than a supply chain one. Not every out-of-stock is recoverable in-quarter. A genuine demand spike you couldn't forecast, or a supplier failure upstream, isn't something a NAM can fix with better execution. That's not the target here.
Avoidable stockout loss is the subset caused by things your execution can actually address:
| Cause | What It Looks Like | Why It's Avoidable |
|---|---|---|
| Phantom inventory | Stock shows as "in system" but is physically absent - in a backroom, mis-scanned, or lost | Reconciliation and physical audit processes |
| DC order rounding | Orders quietly reduced at the distribution centre because a delivery didn't hit a clean pallet weight | Better order management and DC collaboration |
| Shelf-depth failure | Minimum shelf depth set incorrectly, leading to early stockouts at peak trading | Planogram compliance monitoring |
| Replenishment lag | Store runs dry for 3-5 days before anyone notices because the weekly report is always stale | Faster store-level data triggers |
| Unreported shrinkage | Theft or damage recorded in a way that still shows as positive stock in the file | Accurate shrink tracking at SKU level |
| Backroom stock not reaching shelf | Product is in the building but never moved to the shelf face | Industry research puts this at 25-40% of all OSA failures (VisionGroup Retail, 2026) |
This is the category of loss where a NAM - with the right data - can actually do something. And across the UK grocery accounts tracked by GrowSights, avoidable stockout loss typically runs 5-8% of addressable sales. Not occasionally. Not in outlier stores. Consistently, across accounts, every single week.
Industry research consistently shows that 25-40% of out-of-stocks are situations where product is in the building but never made it to the shelf. The inventory system shows it as in stock. The shopper sees an empty facing.
- VisionGroup Retail, On-Shelf Availability Guide, 2026
Ask yourself: What percentage of your last 13 weeks of sales did your team attribute to stockout loss? If the answer isn't precise, the loss is still running.
4. What Shoppers Actually Do When the Shelf Is Empty
The reason this number matters beyond the P&L is what it does to the shopper. And this is where the data is unambiguous.
ECR research on out-of-stock behaviour has established that when a shopper can't find an item, they don't wait. The behavioural splits vary by study but the direction is consistent:
| Shopper Response to an Out-of-Stock | Share of Shoppers |
|---|---|
| Buy a different brand (brand switch) | 31% |
| Leave the store entirely | 26% |
| Buy a different size or variety of the same brand | 19% |
| Delay the purchase | 15% |
| Don't make the purchase at all | 9% |
Source: ECR Retail Loss research on out-of-stock behaviour.
That 31% figure - the brand switchers - is the one that should concentrate supplier attention. That's not a deferred sale. For a meaningful chunk of those shoppers, that's a permanent switch to whoever sits next to your SKU on the shelf. The category manager at the retailer doesn't distinguish between "declined demand" and "you lost a customer because your product wasn't there." Both look the same on the sales chart.
The 2025 Pricer research (polling 1,000+ UK grocery shoppers) confirmed how sharply this is translating into loyalty behaviour:
| Loyalty Impact | Finding |
|---|---|
| Shoppers more loyal to stores with well-stocked shelves | 67% |
| Shoppers who actively avoid retailers with regular stockouts | 58% |
| Shoppers who sometimes leave without buying anything due to stockouts | 42% |
| Households over £125k income who abandon shop due to stockouts | 68% |
| Shoppers who expect core items available every visit | 86% |
Source: Pricer / Retail Times, December 2025.
The high-income figure is particularly significant for premium and branded FMCG suppliers. The shoppers most likely to buy your branded product are the ones least tolerant of not finding it.
And the Retail Economics / DHL audit adds another layer. For "meal for tonight" and "special occasion" shopping trips, roughly three in five shoppers say a missing item would disrupt the entire shop and often trigger a secondary trip to a competitor. That's the premium, high-frequency occasion - exactly where branded FMCG suppliers have the most to lose.
Key insight: The shopper who buys a competitor's product because yours wasn't there doesn't get recorded as a stockout loss in your data. They just disappear from your sales line, quietly, permanently.
5. The Four OSA Failure Types Your Scorecard Can't See
There's a reason avoidable stockout loss doesn't appear on most scorecards. The failure modes are invisible to standard reporting unless you go looking for them.
Here's how each one works and why it doesn't surface in the data your NAM is reviewing:
5.1 Phantom Inventory
This is the most common and the hardest to catch. The retailer's stock management system shows a positive stock count for your SKU in a given store. The store hasn't triggered a replenishment order because the system doesn't think it needs one. But the shelf is empty.
The stock is somewhere - probably in a backroom, possibly mis-scanned during a delivery, occasionally attributed to the wrong SKU. But it isn't on the shelf. And the shopper can't buy it.
Your weekly sell-out report shows reduced sales. Your team reads it as "lower demand week." Nobody reads it as "we had stock in the building that never reached the shelf."
5.2 DC Order Rounding
Delivery quantities are often rounded at the distribution centre - down, to hit a clean pallet weight. A store orders 47 units. The DC ships 40. The 7-unit difference doesn't trigger an exception report because the order was partially fulfilled, not rejected.
Across a 500-store estate, those rounding events add up fast. And they're entirely invisible to your standard sell-in versus sell-out reconciliation.
5.3 Replenishment Lag
Standard supplier reporting from retailer portals operates on a 5-7 day lag. A store ran dry on Wednesday. Your report tells you about it the following Tuesday. The store has been empty for six days. The correction might take another three to four days to reach the shelf. That's approaching two weeks of avoidable loss in a single store on a single SKU.
Without store-level, near-real-time data, this gap is invisible until it's already happened.
5.4 Shelf-Depth and Planogram Failure
Your SKU has a shelf-depth setting - the number of facings allocated and the minimum replenishment trigger. If that setting is wrong, or if the planogram hasn't been correctly implemented across a store estate, your product runs out faster than the replenishment model expects.
This is particularly common after a range review changes the shelf allocation, or after a new planogram is rolled out across a large number of stores where implementation quality varies significantly.
📊 OSA Failure Type Breakdown (GrowSights estimate, UK grocery accounts)
Phantom inventory          ████████████████████  (~35% of avoidable loss)
Replenishment lag          ███████████████       (~28% of avoidable loss)
DC order rounding          ████████████          (~22% of avoidable loss)
Shelf-depth / planogram    ████████              (~15% of avoidable loss)
Estimates based on pattern analysis from UK grocery retailer portal data. Actual split varies by account, format mix, and SKU profile.
6. Why Stockout Recovery is a Different Kind of Growth
Every other lever a NAM pulls to grow an account costs something upfront.
Winning new distribution means displacing an incumbent. Running a promotion means funding a discount and hoping the volume covers the trade spend. Even a well-executed JBP negotiation takes months of relationship-building before it shows up in the numbers.
Avoidable stockout recovery doesn't work like that. Here's the comparison:
| Growth Lever | Pre-Investment Required | New Spend Required | Negotiation Required | Time to Realise |
|---|---|---|---|---|
| New distribution / listing | Range review win | Yes - launch support | Yes - major | 3-9 months |
| Promotional event | Funding agreed with retailer | Yes - trade discount | Yes - campaign level | 4-8 weeks |
| JBP renegotiation | Relationship depth | Sometimes | Yes - strategic | 6-18 months |
| NPD launch | Innovation pipeline | Yes - full launch | Yes - major | 6-12 months |
| Avoidable stockout recovery | None - listing already won | None | Execution level | 2-6 weeks |
The product already exists. The listing is already won. The shelf space is already yours. The trade spend is already committed. The only thing missing is the sale that should have happened but didn't - because the stock was invisible to the system, stuck in a backroom, or never made it from the DC in the right quantity.
Recovering that isn't new growth. It's growth you already paid for and haven't collected.
Put a number on it: for a brand doing £20 million in UK grocery across three major multiples, a 6% avoidable loss rate represents £1.2 million of annual revenue that the business has effectively funded - through listing fees, trade investment, and marketing spend - but never received. Recovering half of that in-year requires no new investment. It requires knowing which stores, which SKUs, which weeks.
This is also why the ROI on closing an availability gap looks different from every other commercial initiative. There's no incremental cost of goods, no trade discount to fund, no logistics uplift. The margin on recovered availability revenue is the same as the margin on the sales you're already booking. It's the purest form of growth available to an FMCG supplier at existing scale.
Closing a 6% availability gap on an existing account requires no new listing, no new promotion, no new trade investment, and no new negotiation. It requires knowing which stores, which SKUs, which weeks.
- GrowSights, from our diagnostic methodology
7. How Availability Failure Destroys Your Position at Range Review
There's a second reason this number matters beyond the weekly P&L. It affects your strategic position at the most important meeting on your commercial calendar.
Every category has a periodic moment where the retailer's category manager looks at a SKU's sales trend and decides whether it keeps its space, loses facing count, or gets delisted. Range reviews happen differently in each account - some are annual, some are rolling, some are triggered by a competitor innovation - but they all work from the same starting point: the sales line.
And here's the problem. A chunk of the softness your NAM walks into a range review carrying isn't declining demand. It's availability failure. Stock that quietly stopped reaching the shelf for weeks at a time, dragging the sales line down in a way that looks identical to genuine consumer decline - unless someone can prove otherwise.
📊 The Availability-Demand Confusion Problem
What the sales chart shows:            What actually happened:

Week 1-4    ████████████ (100)         Week 1-4    ████████████ (100) normal sales
Week 5-8    ████████████ (100)         Week 5-8    ████████████ (100) normal sales
Week 9-12   █████████    (74)          Week 9-12   ██████        (actual demand: 100)
Week 13-16  █████████    (72)          Week 9-12   ░░░░░░        (lost: 26 - availability failure)
Week 17-20  ████████     (68)          Week 13-20  ░░░░░░        (lost: 28-32 per week)

Apparent trend: demand declining       Actual cause: shelf-depth failure, 43 stores
The category manager has their own version of that sales chart. They don't have your store-level availability data. As far as they can tell, the trend is real.
Consider the contrast between two versions of the same range review meeting:
Version A - No availability data: The NAM has a sales chart showing decline. They argue the trend is temporary. They point to marketing investment, NPD pipeline, and consumer research. The category manager already has the same chart. It's a conversation about trust.
Version B - With store-level availability evidence: The NAM shows that this SKU lost 6% of sales to a shelf-depth failure at 43 stores during weeks 9--20. Here are the stores. Here are the weeks. The correction has been implemented this month. The underlying demand for the SKU hasn't changed. The underlying trend is recovery, not decline.
That's the difference between defending shelf space and losing it.
And once space is gone, winning it back costs a full listing fight - range review, trade investment, potential promotional support, months of lead time. That's the most expensive growth lever on the list. Preventing the loss with availability evidence is orders of magnitude cheaper.
This is one of the reasons GrowSights was built. The question "was this a demand problem or an availability problem?" has a data answer. Most suppliers walk into range reviews without it.
8. The Shopper Mission Gap - Where OSA Hits Hardest
Not all availability failures carry the same commercial weight. The Retail Economics / DHL research makes this clear: the mission context of the shopping trip determines how much damage a stockout does.
| Shopping Mission | Sensitivity to Out-of-Stock | Loyalty Risk |
|---|---|---|
| Main weekly shop | High - missing items disrupt the whole trip | Medium - shopper may return next week |
| Meal-for-tonight | Very high - ~60% say missing item disrupts shop | High - often leads to a competitor secondary trip |
| Special occasion | Very high - ~60% disruptive, emotional stakes | Very high - negative memory attached to your brand |
| Top-up shop | Medium - shoppers more tolerant, can defer | Lower - easily substituted or returned for later |
| Non-food / household | Lower - lower urgency, more patient | Low - minimal loyalty impact |
For branded FMCG suppliers, the evening and weekend trading windows - when meal-for-tonight and special occasion missions peak - are exactly when your OSA is most likely to be at its lowest. Shelf-depth settings that work fine for weekday trading often run dry by Saturday afternoon. The replenishment systems aren't calibrated for the peak demand moment.
That's the combination that does the most damage to both short-term revenue and long-term loyalty. And it's the combination that never shows up in the weekly average availability figure that most suppliers are working from.
Key insight for retail leaders: A 90% weekly average on-shelf availability can still mean consistent stockouts at peak Saturday afternoon trading across your most valuable stores. The average disguises when the failure happens.
9. Availability by Format: Why Convenience Is a Special Problem
The Retail Economics / DHL audit found a consistent pattern across store formats:
| Store Format | Typical On-Shelf Availability | Coverage in Typical Weekly Shop |
|---|---|---|
| Hypermarkets | 93-96% | Strong - large backrooms, advanced replenishment |
| Supermarkets | 90-94% | Good - standard replenishment model |
| Convenience / Express | Low-to-mid 80% range | Weaker - limited storage, centralised ordering |
Convenience formats carry approximately one-fifth of UK grocery sales but account for a disproportionate share of displaced spend from stock gaps. The reason is structural: smaller ranges, limited backroom storage, centralised ordering that can't flex quickly to local demand shifts, and higher sales velocity per facing.
For FMCG suppliers with growing convenience distribution - and most mid-market brands are actively growing in this channel - this creates a specific challenge. The distribution gains your NAM has delivered in Express and convenience formats are achieving much lower effective sell-through than the same SKU in a full supermarket. The listing is there. The traffic is there. The stock often isn't.
The leading grocery chains are actively expanding convenience and forecourt estates. Hybrid working patterns and smaller household sizes have made the format structurally larger than it was five years ago. If your NAM's distribution wins are concentrated in this channel, the effective revenue from those listings is likely lower than it looks.
📊 Effective Availability by Format (UK Grocery, 2026 Audit)
Hypermarket      ████████████████████████████████████████ 93-96%
Supermarket      ████████████████████████████████████     90-94%
Express/Convnce  ████████████████████████████             81-85%

UK average                                         89.7%
World-class target                                 97%+
Source: Retail Economics, DHL Supply Chain, The Availability Effect 2026.
10. What the Data Already in Your Business Could Tell You
Here's the thing that surprises most suppliers when they first look at this properly: the data to calculate your avoidable stockout loss usually already exists in your business.
It comes from the same retailer portals your commercial team is logging into every week:
| Retailer | Portal | Data Available |
|---|---|---|
| Tesco | Tesco Connect | Store-level sales, stock-on-hand, availability signals |
| Asda | Asda Supplier Portal | Store-level sell-out, inventory position |
| Sainsbury's | Sainsbury's Supplier Extranet | Store sales, distribution gaps |
| Morrisons | Morrisons Supplier Portal | Store-level data |
Most supplier teams download a version of this data weekly, roll it up into a total account view, and use it to track sales versus plan. The store-level detail - which stores, which SKUs, which weeks - sits in the export, unreviewed.
The work is in taking that store-level data, reconciling it across stores and SKUs, and converting it into a figure your NAM can act on: an avoidable loss rate, by account, by week.
That's exactly what GrowSights does. The data your team already downloads from Tesco Connect, the Asda portal, and the Sainsbury's extranet contains the signal. What's been missing is the process to convert it from a file into a commercial number - and a way to put that number in front of your NAM at the same time they're reviewing volume and distribution.
Most companies don't do this simply because nobody has ever handed them the number to start with.
The data is already in the business. It's the line on the scorecard that's missing.
11. UK Grocery Context: What's Driving OSA Pressure in 2026
On-shelf availability isn't just a supplier execution problem. There are structural pressures in UK grocery right now that are making it harder - and making the gap between good and poor execution wider.
| Pressure | How It Affects OSA |
|---|---|
| Labour constraints at store level | Fewer staff to move stock from backroom to shelf. 61% of shoppers say there are fewer in-store staff than a year ago (Pricer, 2025) |
| Convenience channel growth | Faster-growing format with structurally lower OSA rates - more volume running through a weaker execution model |
| Promotional complexity | More frequent price changes and promotions create planogram disruption that takes days to stabilise |
| DC consolidation | As grocers consolidate distribution infrastructure, more stores are served by fewer depots, increasing vulnerability to single-point failures |
| Real-time shopper expectations | 86% of shoppers now expect core items available every visit (Pricer, 2025) - the bar has moved, the execution model hasn't |
This matters for FMCG suppliers because the environmental conditions are making OSA harder to maintain, not easier. The stores are less staffed. The supply chain is more consolidated. The shopper is less tolerant. And the data to respond is sitting in portal exports your team already downloads but doesn't fully use.
Two-thirds of UK shoppers say they are more loyal to stores with well-stocked shelves, while 58% actively avoid retailers that are regularly out of stock.
- Pricer / Retail Times, December 2025
For context on how the wider UK mid-market retail landscape is creating commercial pressure on suppliers, our piece on UK mid-market retail growth patterns covers the structural headwinds that make every percentage point of avoidable loss more expensive.
12. Competitor Comparison: OSA as a Competitive Differentiator
Most FMCG categories in UK grocery have two or three significant competitors fighting for the same shelf space. In that context, on-shelf availability isn't just about your sales - it's about what happens when your shelf goes empty and the competitor next to you is consistently in stock.
| Supplier OSA Position | Typical Outcome at Range Review | Shopper Switching Risk |
|---|---|---|
| Consistently 95%+ | Strong sales line, easy range defence | Low - shopper finds product, purchase completes |
| 90-94% (sector average) | Moderate - some softness, narrative needed | Medium - occasional switching |
| Below 90% | Sales line soft, category manager questioning | High - habitual switching begins |
| Chronic gaps at specific stores | Sales line shows decline, delisting risk | Very high - permanent brand-switchers being created |
The supplier with consistently better OSA in a category has a structural sales advantage that doesn't show up in any consumer research. It's not about brand equity or marketing investment or packaging renovation. It's about whether your product is there when a shopper goes to buy it.
The ECR research established that of 100 shelf out-of-stock incidents, roughly 43 lead to lost revenue once brand and size switching behaviour is counted. The other 57 lead to some form of substitution or deferral - but even those carry latent switching risk if they repeat.
Key insight for FMCG commercial teams: Your competitor's availability failure is a category opportunity. Your availability failure is a loyalty transfer to them. Neither shows up in your brand tracking until the switch has already happened.
13. Building OSA Into Your NAM's Commercial Plan
Putting avoidable stockout reduction on the NAM scorecard isn't complicated. It doesn't require new technology on day one. It requires treating availability the same way you already treat waste percentage or promotional ROI - as a commercial metric with a baseline, a target, and an owner.
Here's what that looks like in practice:
Step 1: Establish a Baseline
Pull the last 13 weeks of store-level data from your retailer portals. Don't look at the account total - look at which stores, which SKUs, which weeks had availability below your threshold. Quantify the gap as a percentage of addressable sales. Not an industry estimate. Your actual number.
Step 2: Set a Target
A 5% avoidable loss rate moving to 3% over two quarters is a realistic, defensible commercial objective. It's specific enough to act on and meaningful enough to move the business.
| Target State | Avoidable Loss Rate | Revenue Impact (£20M account) |
|---|---|---|
| Current typical position | 5-8% | £1M-£1.6M lost annually |
| Year 1 target | 3-4% | £600K-£800K lost annually |
| World-class execution | Below 3% | Below £600K lost annually |
| Recovery opportunity (5% to 3%) | 2 percentage points | ~£400K reclaimed, zero incremental cost |
Step 3: Give It an Owner
If nobody owns it, it doesn't get reviewed. The NAM who manages Tesco owns the Tesco number. The NAM who manages Asda owns the Asda number. Availability loss is measured and reviewed alongside every other line on their scorecard.
Step 4: Review It Quarterly
The same cadence as promo ROI, waste percentage, and forecast accuracy. Not a supply chain meeting. A commercial review, with the same weight as every other measure.
Step 5: Treat It as Growth, Not Hygiene
The language matters. Avoidable stockout reduction isn't a supply chain clean-up exercise filed under someone else's cost centre. It's the highest-margin growth available to your business on existing accounts, because it requires no incremental investment to capture.
Ask yourself: If your NAM was told their quarterly bonus had a 20% weighting on avoidable stockout reduction, how quickly would they find the data to track it?
Key Lessons for FMCG Commercial Leaders
Lesson 1: The Scorecard Shapes the Behaviour
NAMs track what they're measured on. If on-shelf availability isn't on the scorecard, it won't be tracked - regardless of how commercially significant the loss is. The absence of the metric isn't a sign that it doesn't matter. It's a legacy of how the scorecard was built before store-level retailer portal data was accessible enough to act on.
Ask yourself: What would change about your NAM's weekly priorities if they started their Monday morning by reviewing store-level OSA gaps alongside their sales-versus-plan chart?
Lesson 2: Average Availability Hides the Real Problem
An 89.7% UK grocery average sounds like a small gap. But 89.7% across a week, across a full store estate, across all SKUs, doesn't tell you that your hero SKU was out of stock in your top 50 Tesco stores from Thursday to Tuesday. The average smooths the peaks into a number that seems manageable. The store-level weekly view reveals the true commercial exposure.
Ask yourself: Does your team look at availability as a weekly account average or as a store-level, SKU-level signal that can trigger a commercial response?
Lesson 3: Range Reviews Are Won and Lost on Evidence, Not Narrative
The category manager at any of the big four grocery chains is running their own data. When your sales line shows a trend, they have an opinion about it. Your NAM walking in with "we believe demand is still strong" is competing against a chart that says otherwise. The NAM who walks in with store-level availability evidence - proof that the trend is an execution artefact, not a demand signal - is in a completely different conversation.
Ask yourself: In your last range review, could your NAM separate availability failure from genuine consumer decline with evidence? If not, what was the outcome?
Lesson 4: The Cost of Not Tracking This Compounds
Unlike promotional waste or forecast accuracy, avoidable stockout loss compounds in two ways. First, the revenue loss accumulates week over week with no recovery mechanism in place. Second, every week of stockout is creating a small cohort of shoppers who have switched to a competitor - and a percentage of those won't come back. The longer it runs untracked, the more structural the damage becomes.
Ask yourself: If your avoidable stockout loss has been running at 6% for three years, what's the cumulative revenue figure - and how many of those shoppers have permanently switched?
Lesson 5: This Is Already in Your Data
You don't need to build new data infrastructure to start tracking this. The signal is in the retailer portal exports your team already downloads. The work is in pulling it into a usable form and putting it in front of the person who can act on it. That's a process change, not a technology project.
Ask yourself: How long would it take your team to produce a 13-week avoidable loss rate by account, using the data currently sitting in your supplier portal downloads?
Actionable Recommendations
For FMCG Brand Owners and Commercial Directors
- Add avoidable stockout reduction to your NAM scorecard this quarter. Give it the same weight as waste percentage or forecast accuracy as a starting point.
- Pull 13 weeks of store-level data from your retailer portals and calculate a baseline avoidable loss rate. Do this before setting a target.
- Set a specific, time-bound target - 5% to 3% in two quarters is a reasonable starting point for most accounts.
- Brief your category teams on the distinction between availability failure and demand decline. This shapes how they interpret the sales data they review weekly.
- Review your convenience channel distribution separately from your supermarket estate. The OSA dynamics are structurally different.
For National Account Managers
- Start your weekly review with store-level data, not account totals. The average is where problems hide.
- When you see a sales dip in a store cluster, ask the availability question before the demand question.
- Build availability evidence into your range review preparation the same way you build promotional ROI evidence. The category manager has a chart. You need a counter-narrative with data behind it.
- Work with your supply chain and logistics colleagues to understand where DC order rounding is happening. This is often the easiest availability gain to realise quickly.
- Understand your planogram compliance rates at store level. A planogram that's correctly set in 60% of your estate is delivering availability failure in 40% - every week.
For Supply Chain and Commercial Operations Leaders
- The availability problem lives at the intersection of commercial and operations. It needs a cross-functional owner, not a supply chain ticket.
- Investigate the lag in your retailer portal data. If you're working from a 7-day lag on sell-out signals, you're responding to last week's problem, not this week's.
- Review your DC order rounding policies with your logistics partners. Small changes in how partial-pallet orders are handled can significantly reduce the gap between what stores order and what they receive.
- Consider weekly availability reviews as a standard commercial meeting agenda item - the same way weekly sales vs. plan already is.
Final Summary
| Failure Category | What's Going Wrong | What Your Business Should Do |
|---|---|---|
| Missing scorecard metric | Avoidable stockout loss has no line, no owner, no target on any NAM scorecard | Add it this quarter - same weight as waste %, same cadence as promo ROI |
| Data is there but unprocessed | Store-level OSA signal sits in retailer portal exports, never converted into a usable commercial number | Process the last 13 weeks to establish a baseline before setting a target |
| Loss misread as demand decline | Sales dips from availability failure are interpreted as consumer trends - at range review, this costs shelf space | Equip NAMs with store-level availability evidence to separate the two |
| No commercial recovery mechanism | Without a tracked metric, avoidable loss compounds week-on-week with no trigger for action | Make recovery of avoidable loss a named commercial objective, not a supply chain task |
| Convenience channel blind spot | OSA rates in convenience formats are structurally 5-10 points below supermarkets - distribution gains in this channel deliver lower effective revenue than they appear | Track convenience and supermarket OSA separately; don't let the account average hide the format gap |
| Range review vulnerability | Suppliers without availability evidence walk into range reviews unable to distinguish their performance from genuine consumer decline | Build store-level OSA data into every range review pack - the category manager has a chart; you need counter-evidence |
| Phantom inventory unchecked | System shows stock, shelf is empty - replenishment isn't triggered, loss accumulates invisibly | Implement regular physical audits at key stores and reconcile system stock against observed availability |
Grow Your Business With Integrated Data and Operational Intelligence
This is exactly the gap GrowSights was built to close. Account after account, the same pattern shows up: a brand with good distribution, reasonable trade investment, and a NAM who knows their numbers cold - except the one that matters most.
If you want to understand how we work and how quickly a store-level availability picture can be built from data your team already has, we're happy to walk you through it. And if you want to know what your actual avoidable stockout number is - not an estimate, not an industry benchmark, your real figure - we'll run a free four-week pilot using the data your team already downloads.
Four weeks. No cost. No commitment. You get back exactly where the loss is happening, store by store, and what it's costing. That's the number your NAM should already have. We can give it to you so you can decide for yourself whether it belongs on their scorecard.
Start your free 4-week availability pilot
Frequently Asked Questions
What is on-shelf availability (OSA)? On-shelf availability is the percentage of time a product is physically present and purchasable on the shelf when a shopper looks for it. It differs from the system-level "in stock" figure, which can show stock that's actually sitting in a backroom, incorrectly attributed to another SKU, or lost to shrinkage.
What is avoidable stockout loss? Avoidable stockout loss is the subset of OSA failure caused by execution issues that can be fixed in-quarter: phantom inventory, DC order rounding, shelf-depth miscalibration, replenishment lag, and unreported shrinkage. It excludes genuine upstream supply failures or unforecastable demand events.
What's a good on-shelf availability rate in UK grocery? The UK grocery average is 89.7% (Retail Economics / DHL, 2026). World-class retail execution sits meaningfully above that, with leading FMCG suppliers targeting avoidable stockout loss of 3% or below against a typical baseline of 5-8%.
Should on-shelf availability be a National Account Manager KPI? Yes. It meets every test the existing NAM KPIs meet: it's measurable, financially material, responds to execution quality, and directly affects the retailer relationship. The only historical reason it's been absent is that most suppliers haven't had the number in a usable form.
Where does the data come from? In most cases, from retailer portal exports your team already downloads weekly - Tesco Connect, the Asda Supplier Portal, and the Sainsbury's Supplier Extranet. The raw signal is usually already in your business. The work is in reconciling it store by store and converting it into a loss figure your NAM can act on.
How does poor availability affect a range review? Availability failure depresses the sales line in a way that's visually indistinguishable from declining demand. Without store-level evidence, a supplier walks into a range review unable to separate the two - and risks losing space to a trend that was never a consumer problem in the first place.
How quickly can stockout loss be recovered once tracked? The fastest gains typically come within two to six weeks of identifying specific store-level failure clusters - particularly where phantom inventory or DC order rounding are the cause. These can be corrected relatively quickly once the specific failure mode is identified. Shelf-depth and planogram corrections take slightly longer, depending on the retailer's planogram implementation cycle.
Research sources:
- Retail Economics / DHL Supply Chain, "The Availability Effect: Why trust, margin and loyalty start at the shelf edge," 2026. https://www.retaileconomics.co.uk/retail-insights/thought-leadership-reports/the-availability-effect-trust-margin-loyalty-grocery-2026
- ECR Retail Loss, on-shelf availability research. https://ecrloss.com/category/on-shelf-availability
- Pricer / Retail Times, "Stockouts cost loyalty as UK shoppers walk away from empty shelves," December 2025. https://retailtimes.co.uk/stockouts-cost-loyalty-as-uk-shoppers-walk-away-from-empty-shelves/
- Pricer / KamCity, "New Research Suggests On-Shelf Execution Is Now The Biggest Loyalty Driver In Grocery Retail," December 2025. https://www.kamcity.com/namnews/uk-and-ireland/supermarkets/new-research-suggests-on-shelf-execution-is-now-the-biggest-loyalty-driver-in-grocery-retail/
- VisionGroup Retail, "On-Shelf Availability: What It Is, Why Most CPG Brands Measure It Wrong, and How to Actually Fix It," 2026. https://visiongroupretail.com/blog/on-shelf-availability-osa-guide-measurement-fixes
- Retail Times / Pricer, "UK consumers say almost a fifth of items in weekly food shop are out-of-stock in-store," 2024. https://retailtimes.co.uk/uk-consumers-say-almost-a-fifth-of-items-in-weekly-food-shop-are-out-of-stock-in-store-pricer-reveals/
- Pygmalios, "State of Shelf Availability & Store Foot Traffic," 2026. https://www.pygmalios.com/reports/pygmalios-state-of-retail-2026.pdf
Published by GrowSights | Retail Intelligence and Growth Engineering | Point of View