Getting Into Tesco Is The Easy Part. Staying There Is The Real Game.
Every founder remembers the day their brand got listed in Tesco. Fewer remember the category review that nearly got them delisted eighteen months later.
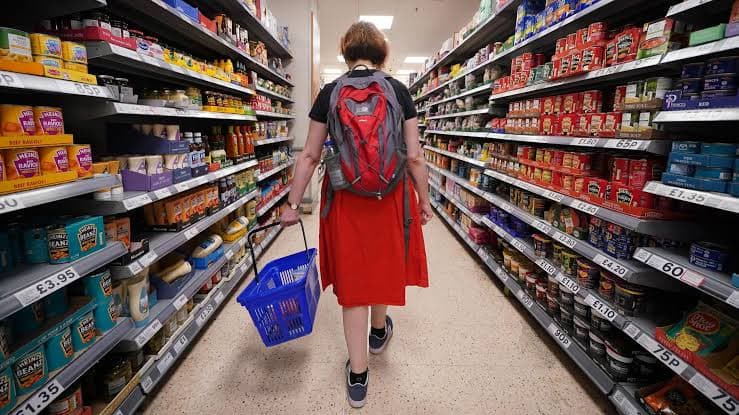
This one started with an ordinary trip to Tesco to pick something up, not a research mission. While we were there, we ended up walking the aisles slower than usual and noticed something that's stuck with us since. We've posted some of what we saw on LinkedIn already this is the longer version, with the research and the numbers behind it.
That's the part nobody warns you about when you're chasing the listing. So before you pitch a buyer, here's what actually happens once you're in because the listing is not the finish line. It's the start of a recurring exam you have to keep passing, twice a year, forever.
What we actually saw on the shop floor
A spreadsheet will tell you a product is "in stock." Standing in the aisle tells you something else.
What we noticed was a gap on the shelf where a product should have been, on a SKU that, as far as we could tell, wasn't actually out of stock anywhere in the system. That's the kind of moment that's easy to walk past as a shopper. It's a much bigger deal if you're the brand whose facing that was.
It's not an unusual thing to stumble on. It's a structural, well-documented feature of how grocery retail actually works, and it has a name in the academic literature: phantom inventory, where stock is recorded as available somewhere in the supply chain while the shelf itself sits empty. We'll come back to it, because it sits underneath almost every number in this article.
The scale you're walking into
Tesco works with over 2,500 suppliers and holds 29.1% of total UK grocery spend, more than Sainsbury's, Aldi, and Lidl combined in terms of share. A single Tesco store can carry anywhere from 15,000 to 60,000 active SKUs at any given time.
Here's the part that should change how you think about getting listed: product launches across UK supermarkets fell from over 8,200 in 2018 to just under 5,300 in 2023. The shelf isn't growing. It's shrinking, on purpose, through aggressive range rationalisation. Out of roughly 1,350 SKU-level launches a year across UK grocery, genuinely new brand relationships are estimated at only 200 to 400 a year across every major retailer combined.
And most of those launches don't make it. Nielsen's Breakthrough Innovation research, built from an analysis of more than 12,000 new FMCG launches across Europe, found that 76% of new product launches fail within their first year, and that two-thirds of new SKUs never even reach 10,000 units sold. Separate analysis from eCommerce analytics platform E Fundamentals puts a number on what that costs the UK specifically: failed product launches waste a minimum of £30.4 million a year across UK grocery retail, with over £2.1 million of that lost through online grocery platforms alone.
The brutal part is that a launch can fail for reasons that have nothing to do with the product. If a shopper can't find it on shelf in the first few critical weeks of distribution, the product never gets the chance to prove itself. The data and the trial never meet.
Tesco, to its credit, is the most open of the Big Four to branded innovation. It runs structured category reviews and an Incubator programme specifically for challenger brands, and regional trials are common before anything goes national. Aldi and Lidl, by contrast, are over 90% private label branded suppliers are a rounding error there. Sainsbury's, Waitrose, and Ocado tend to move faster and listen more at the early stage than Tesco does at full scale.
If you're a challenger brand, Tesco is winnable. It's just not casual.
How a brand actually gets onto the shelf
Getting listed isn't a single yes. It's a sequence:
1. You get noticed before you get reviewed. Buyers don't discover brands cold. They notice momentum signals a fundraise, a fast-growing DTC base, a competitor stumbling, retail press coverage, a founder making noise in the right rooms. This is the unglamorous groundwork that happens months before any pitch deck gets opened.
2. You enter a category review. Major categories are reviewed by category managers one to two times a year, usually in two windows: January to March, right after the Christmas clearout, and August to October, while the buyer is building next year's Christmas range and cutting underperformers at the same time. If your pitch timing doesn't align with these windows, you're not being rejected. You're early or late to a door that opens on a schedule you don't control.
3. You make the incrementality case. A buyer doesn't just ask "will this sell." They ask "will this sell to someone who wasn't already buying in this category." A new launch that simply cannibalises an existing SKU on the shelf, including the retailer's own private label, is a much harder sell than one that proves it pulls in a new shopper. Bring the data, not the story.
4. You negotiate the cost of being on shelf. Slotting fees average around $1,500 per store per SKU. A single range review can introduce 7 to 12 new SKUs in a 1,000-store chain, that math gets serious fast. This is also where pay-to-stay dynamics show up: existing suppliers facing delisting can offer discounts, signage, or bundled product to keep their spot, which is part of why an incumbent brand sitting still is more vulnerable than people assume.
5. You go live, regionally first, then nationally. Tesco in particular favours regional trials before a full rollout. This is the quiet, dangerous part. Most founders treat launch day as the win. It's actually the start of a new clock.
What happens after you're listed the part that decides if you stay
Once you're on shelf, Tesco's category managers are watching five numbers, on a rolling basis:
| What they measure | What it means | The threshold that gets you flagged |
|---|---|---|
| Rate of Sale | Units sold per store per week | Below roughly 2–3 units/store/week, you're a candidate for cutting |
| Weighted Distribution | % of stores stocking you, weighted by volume | Below 30%, you're at delisting risk |
| Incrementality | New-to-category sales vs. just switching | Must be net positive for the retailer, not just for you |
| Promotional Response | Sales lift during a deal period | Below 1.5x baseline, your promo case looks weak |
| Availability | In-stock % across listed stores | Below 90%, it gets flagged as a supply chain problem |
That last one is the one almost nobody is actually watching closely enough and it's the one that matches what we stumbled on in that aisle.
The most cited academic study in this space, Corsten and Gruen's analysis of 661 retail outlets across 29 countries, found an average out-of-stock rate of 8.3%. That number has been disturbingly stable for decades the original 1996 Coca-Cola Research Council benchmark found 8.2%, and ECR Europe's 2003 study across the same Northern European markets the UK sits in found out-of-stock rates of 7 to 10% depending on category, ranging from 5% for canned food up to 18% for fresh meals. Nearly thirty years of research, and the number barely moves. From a shopper's perspective, an 8% out-of-stock rate means roughly 1 in every 13 items they go looking for simply isn't there.
More recent UK consumer research from Retail Insight puts a sharper, more current edge on this: 82% of UK shoppers reported experiencing an out-of-stock product in-store within the past 12 months, up 11 percentage points year on year. Sixty percent said their favourite brands have become less available in-store over the same period. The same research found that inventory records are often only 50 to 60% accurate against what's physically on the shelf which lines up with what that gap in the aisle probably was: stock that existed somewhere on paper, just not where the shopper needed it.
And the consumer response to that gap is not patient. Research consistently shows that when a shopper hits a stockout, roughly 70% don't wait they switch to whatever competing brand is visible in that shelf position right then, around 30% leave and complete the purchase at a different retailer entirely, and only a small remainder wait for a restock. For an established brand, that's a straight revenue leak. For a newly listed challenger brand still building awareness in its critical first weeks on shelf, it's worse a shopper who never found you in the first place has no relationship to come back to.
Academic root-cause research on out-of-stocks attributes roughly 72% of all OOS events to causes that originate inside the store itself rather than further up the supply chain and inventory record inaccuracy alone, the same phantom-inventory problem, is estimated to account for around a quarter of those store-level events by delaying re-shelving and re-ordering decisions that should have happened already.
Here's the trap that catches even brands that think they're watching closely. A brand can be growing its rate of sale nationally, look completely healthy in the topline numbers, and still be quietly bleeding shelf space because availability in specific regions has fallen off a cliff that the national average hides perfectly. Scotland sitting at 12% in-stock while the national figure reads 89% isn't a hypothetical. It's exactly the kind of regional blind spot that's become a live issue since Tesco started reporting Scotland separately from the national figure in April 2026. Brands that thought they had a healthy listing found out they'd been hiding a supply chain problem inside their own dashboard.
ECR's own research sets 98%+ on-shelf availability as the threshold below which stockout frequency starts to create measurable shopper switching behaviour. Most brands, even ones who believe they're performing well, are operating well below that line without realising it because the number they're checking comes from the inventory system, not the shelf itself.
A brand loses shelf space, or gets cut entirely, for five reasons: rate of sale falling below the buyer's threshold, the retailer's own private label expanding into your space, distribution gaps or phantom inventory eroding the buyer's confidence in your supply chain, failing to show up for seasonal or promotional programmes, or simply losing the incrementality argument to a competitor's stronger category review submission next cycle.
Three of those five are availability problems wearing a different name.
The signal that tells you when the pressure is actually on
If you only remember one date from this article, make it the August to October window. That's when category managers are simultaneously building next year's Christmas range and deciding which underperformers get cut to make room for it. Growing and fast-growing brands feel the most pressure in exactly this window, because this is when the buyer's whole job is comparison. Your category review submission isn't being judged on its own merits. It's being judged against everyone else's, at the same time, by someone who has to make room.
If your data story isn't airtight going into that window, you're not bringing a pitch. You're bringing a guess to a room full of other people's facts.
Why most brands lose this without ever seeing it coming
Across the active UK brand universe, somewhere between 800 and 1,200 brands at any given time are sitting in what's effectively the crisis zone: shelf space flat or contracting, momentum stalling, and no clear internal signal telling them why. Another 150 to 300 brands are growing fast enough to be a buyer's favourite case study this year and a phantom inventory cautionary tale next year, because fast growth without supply chain visibility is exactly how a brand outruns its own ability to stay in stock.
The pattern repeats with almost boring consistency. A brand wins the listing. The team celebrates, rightly. Then nobody builds the muscle to watch rate of sale, weighted distribution, and regional availability with the same intensity that went into winning the pitch in the first place. Six months later, a Friday call from the buyer surfaces a problem the team didn't know existed, because the warning signs were sitting in a Tesco portal export, a Cin7 report, and a distributor spreadsheet that nobody had reconciled that week.
It compounds in the promotional calendar too. Branded promotions account for roughly 35% of all UK FMCG grocery sales, and that share is still climbing. But around 60% of trade promotions never even break even, and the research consistently finds a roughly 2:1 ratio of out-of-stock rates on promoted items versus non-promoted ones the moment a brand finally gets the promotional slot it fought for, it's also the moment it's statistically most likely to run out. A buyer watching the Promotional Response metric from the table above doesn't see the explanation. They just see a weak number, at the worst possible time to show one.
Analytics didn't fail here. Nobody acted on it, because nobody was looking at the right number at the right moment.
That's the whole game, every category review, twice a year, for as long as you want to keep your shelf space. Getting in is the pitch. Staying in is the discipline.
We saw it for ourselves on the shop floor, not just in a report. If you want the shorter, sharper version of this story, we posted it on LinkedIn first this article is the full data behind it.
Growsights helps UK FMCG brands selling through Tesco, Sainsbury's, Asda, Ocado, and Waitrose close the gap between what their data shows and what their team actually does about it. If you want to know what your regional availability looks like behind the national average, start a conversation.