The 15 Retail Inventory KPIs Every UK Business Should Be Tracking in 2026
If you're not measuring it, you're not managing it -- and in UK retail right now, that's not a metaphor. It's a financial emergency.
Global inventory distortion -- the combined cost of stockouts and excess stock -- is estimated at $1.7 trillion a year by IHL Group. British retailers are carrying their share of that weight, and in a market where high street footfall declined for seven consecutive months in 2025 and shrinkage hit a 20-year high of £7.9 billion in 2023, the margin for waste is essentially gone.
Yet despite this, more than 40% of mid-market retailers still manage inventory through spreadsheets. Fewer than a quarter of UK SMBs have invested in AI-driven inventory analytics. And most inventory teams still spend hours building backward-looking reports instead of acting on forward-looking signals.
The problem isn't that retailers don't understand inventory. It's that they're not tracking the right indicators, at the right frequency, with the right connection between signal and action.
This article covers the 15 inventory KPIs that matter most for UK retailers in 2026 -- what each one measures, the benchmarks you should know, and why tracking them without acting on them is just as expensive as not tracking them at all.
1. The Scale of the Problem: What Inventory Mismanagement Actually Costs UK Retailers
Before we get into the metrics, the numbers deserve full attention. Inventory mismanagement isn't a background hum -- it's a primary driver of retail failure.
| Metric | Figure | Source |
|---|---|---|
| Global inventory distortion cost | $1.7 trillion/year | IHL Group, 2025 |
| Global stockout cost alone | $1.2 trillion/year | IHL Group, 2025 |
| UK retail shrinkage (2023) | £7.9 billion -- 20-year high | Deloitte / BRC |
| Projected UK retail shrinkage (2025) | ~£9 billion | NetSuite UK |
| UK retailers spending on shrinkage prevention | £1.8 billion/year | BRC |
| Customers who won't return after a stockout | 91% | Swell / Netstock |
| Customers who switch brands after a stockout | 69% | Harvard Business Review |
| Retailers with inventory accuracy below 80% | Over 50% | Unleashed Software |
| Average industry inventory accuracy | 83% | Opensend |
| Small businesses tracking inventory manually | 43% | Swell |
| UK retail sales total (12 months to Nov 2025) | £531.6 billion | ONS |
For a mid-market retailer with £20 million in turnover, that 1.4% to 1.7% industry shrink rate translates to £280,000 to £340,000 in direct annual losses before a single security hire or camera is installed. Storage costs alone eat another 20% to 30% of inventory value each year. And every stockout carries a hidden multiplier: two-thirds of customers who can't find what they want in a physical store walk straight out the door.
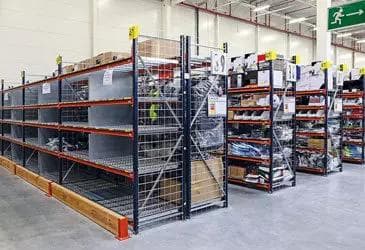
 Caption: Effective stockroom organisation is the physical foundation of reliable inventory KPI performance. Source: Biyo POS
Key insight: The retailers outperforming on inventory in 2026 are not spending more on stock. They are spending less -- because they know exactly what's selling, what's sitting, and what's silently disappearing.
2. Inventory Accuracy -- The KPI Everything Else Is Built On
Formula: (Accurate inventory records / Total inventory records) x 100
Healthy benchmark: 95%+ for high-performing operators; industry average sits at 83%
Here's the uncomfortable truth that most mid-market retailers don't want to confront: if your inventory accuracy is below 90%, every other KPI in this list is unreliable. Stockout rates, fill rates, forecast accuracy -- they're all built on inventory records. If those records don't match physical reality, you're optimising against fiction.
Poor inventory accuracy creates what the industry calls phantom inventory: products that appear as available in your ERP or POS but physically don't exist on the shelf. A 2025 report by Appriss Retail found that phantom inventory is one of the most cited root causes of availability failures -- and one of the hardest to detect without regular cycle counting.
The sources of inventory inaccuracy are consistent across sectors:
| Source | Contribution to Inventory Error |
|---|---|
| Employee theft | ~40% of UK retail shrink (Retail Economics) |
| Shoplifting / ORC | ~35% |
| Administrative errors | ~15% |
| Supplier fraud / delivery shortfalls | ~10% |
"Most of the loss -- distortion, stockouts, miscounts -- traces back to one root cause: inventory records that don't match reality. You don't need AI to fix that first; you need a single source of truth across every location, channel, and sales platform." -- GOIS Inventory Management Statistics Report, 2026
Best-in-class retailers achieve 95%+ accuracy through a combination of RFID tagging, disciplined cycle counting, automated discrepancy alerts, and clean returns processing. The 12-point gap between average (83%) and world-class (95%) accuracy is where stockouts hide, forecasts break, and working capital gets wasted.
Ask yourself: Could you stake £1 million on the accuracy of your current inventory records? If the answer is no, that's where to start -- not with AI, not with forecasting tools, not with reorder algorithms.
3. On-Shelf Availability (OSA) -- What Customers Actually Experience
Formula: (Available SKUs / Total SKUs) x 100
Healthy benchmark: 97%+ for grocery; 92%+ for general merchandise
Inventory accuracy tells you what's in the system. On-shelf availability tells you what the customer can actually buy. These are not the same number -- and in most retailers, the gap between them is where sales quietly disappear.
A product can exist in your warehouse, be accurately recorded in your ERP, and still not be available to a customer because it hasn't been replenished to the shelf, it's in the wrong location, or it's in the back room waiting for a staff member who's occupied elsewhere.
Research consistently shows that a 1% improvement in on-shelf availability drives a 0.5% increase in sales. For a retailer turning over £15 million, closing a 3-point availability gap is worth roughly £225,000 in additional annual revenue -- without touching price, promotions, or range.
📊 ASCII Index: Illustrative OSA gap and revenue impact
OSA at 94%  ██████████████████████████████  (Base)
OSA at 97%  ████████████████████████████████ (+£225k on £15M turnover)
OSA at 99%  █████████████████████████████████ (+£375k on £15M turnover)
Illustrative index based on 0.5% sales uplift per 1% OSA improvement
The omnichannel complexity of 2026 makes this harder to track than it sounds. With 28.1% of UK retail sales now occurring online (ONS, October 2025), availability has to be measured across store shelves, click-and-collect bays, and digital product pages simultaneously. A product showing "in stock" online but unavailable for same-day collection is an availability failure the customer experiences as a broken promise.
4. Stockout Rate -- Counting What You Failed to Sell
Formula: (Out-of-stock SKUs / Total SKUs) x 100
Healthy benchmark: Below 3% for general merchandise; below 1% for core lines in FMCG
The stockout rate is the inverse of availability -- but it deserves its own tracking because it tells a different story. Availability tells you what percentage of your range customers can buy today. Stockout rate tells you how often your replenishment and forecasting systems are letting you down.
The consequences are asymmetric. A stockout costs you not just the immediate sale, but in most cases, the customer relationship. Research cited by Harvard Business Review found that 69% of consumers experiencing a stockout will purchase from a competitor instead of waiting for your product to return. Of those, a significant proportion don't come back at all.
| Stockout consequence | Estimated impact |
|---|---|
| Immediate lost sale | 100% of that transaction value |
| Customer switches brand | 69% of stockout cases |
| Customer doesn't return | Subset of brand switchers (sector-dependent) |
| Basket reduction for remainder of trip | Documented across FMCG research |
| Brand trust erosion | Cumulative, hard to quantify |
For UK mid-market retailers in 2026, the pressure on stockout rates has increased due to extended supply chain lead times. AXA Commercial's mid-market retail analysis found that container shipping costs surged up to 300% and average shipment delays extended to 3-4 weeks in recent years, forcing higher safety stock requirements and making reactive replenishment extremely costly.
Key insight: Tracking stockout rate by SKU, by location, and by time of day (not just as an average) is what separates retailers who fix availability from those who report on it. GrowSights' Stockouts tool runs a daily 4-signal classification across every SKU x store combination -- ranking each alert by the exact revenue it's costing per day, so your team always knows which fires to fight first.
5. Inventory Turnover -- The Pulse Check for Cash and Demand
Formula: Cost of Goods Sold (COGS) / Average Inventory Value
Sector benchmarks (2026):
| Retail Sector | Typical Inventory Turnover | Days on Hand |
|---|---|---|
| Grocery / FMCG | 14x to 20x | 18 to 26 days |
| Fashion / Apparel | 4x to 8x | 46 to 91 days |
| Beauty & Health | 4x to 6x | 61 to 91 days |
| Pet care / specialist | 5x to 8x | 46 to 73 days |
| Furniture / home | 2.5x to 5x | 73 to 146 days |
| Electronics | 4x to 8x | 46 to 91 days |
Source: AisleStock 2026 benchmarks, anchored to 10-K filings; Onramp Funds 2025 sector analysis
Inventory turnover is one of the most frequently cited KPIs and one of the most frequently misused. The number means nothing without sector context. A fashion retailer at 4x and a grocer at 4x are in completely different situations -- one is performing solidly, the other may be in trouble.
What matters more than the headline turnover figure is the trend and the segment. Which categories are turning fast? Which are sitting? A high average turnover can mask slow-moving lines that tie up working capital and risk obsolescence. A low average can include fast-moving lines that deserve more investment.
The practical implication for mid-market retailers is to compute turnover at category level -- not just across the total business -- and to investigate any SKU sitting significantly below its category benchmark.
"Compute turns with COGS over a smoothed average inventory at cost. Complement it with Days Inventory Outstanding for operational intuition and GMROI for capital effectiveness. Segment by category, brand, store, and channel to reveal outliers and opportunities hidden in roll-ups." -- Cleverence Inventory Intelligence, 2026
6. Sell-Through Rate -- The Fastest Read on Product-Market Fit
Formula: (Units sold / Units received) x 100
Healthy benchmark: 75% to 80% indicates well-matched stock; below 50% signals a problem; approaching 100% risks stockouts
Sell-through rate is the metric that tells you the truth about a product faster than anything else. It cuts through the noise of aggregate sales figures to answer the only question that matters at SKU level: is this product actually selling at the rate we expected?
A sell-through rate approaching 100% sounds great -- but it means you're almost certainly losing sales because you underordered. A rate below 50% means you've tied up working capital in stock that isn't moving, and a markdown is coming. The sweet spot is 75-80%, which gives you enough margin to keep shelves full through a replenishment cycle without the risk of running empty.
ONS data from October 2025 showed 63% of UK consumers reported cost-of-living pressure that month, with 95% citing food costs specifically. This affects sell-through directly: categories that don't represent essential spending are seeing demand volatility that makes the 75-80% window harder to hit consistently.
Sell-through is especially valuable as a post-promotion diagnostic. You launched a campaign. Did the product actually sell at the expected rate? If it didn't, the problem might be pricing, placement, messaging, or a product that was never going to respond to promotion in the first place.
Ask yourself: Are your slowest sell-through categories getting the same order volumes they got three years ago? Consumer preference shifts over 24-36 months. Your buying patterns often don't.
7. Days Inventory Outstanding (DIO) -- The Working Capital Lens
Formula: (Average Inventory / COGS) x 365
Healthy benchmark: Sector-dependent; 30-60 days is typical for mid-market general merchandise; lower is generally better but must be balanced against stockout risk
If inventory turnover tells you how fast stock is cycling, Days Inventory Outstanding tells you how long each pound of stock sits on your balance sheet before becoming revenue. This is the metric your CFO thinks about when the bank asks about working capital efficiency.
The practical difference between a retailer with 45 DIO and one with 90 DIO on the same revenue base is roughly six weeks of working capital -- cash that could be deployed in marketing, technology, or new range investment instead of sitting in a warehouse.
📊 DIO: Working capital impact on a £20M turnover mid-market retailer
DIO at 90 days  ████████████████████████  (£4.9M tied up in inventory)
DIO at 60 days  ████████████████          (£3.3M tied up in inventory)
DIO at 45 days  ████████████              (£2.5M tied up in inventory)
Illustrative calculations based on COGS representing ~60% of revenue
A Wall Street Journal / Deloitte analysis of working capital found four primary levers for improving DIO without damaging availability: tighter demand forecasting, supplier relationship management to reduce lead times, better safety stock calibration, and disciplined markdown protocols for slow movers.
The warning: over-tightening DIO in pursuit of a lower number is one of the fastest ways to create stockouts. The objective is optimisation, not minimisation. The target DIO for your business is the one that keeps shelves full while freeing maximum cash.
8. Gross Margin Return on Inventory Investment (GMROI) -- Is Your Stock Making Money?
Formula: Gross Margin / Average Inventory Cost
Healthy benchmark: Above 1.0 means you're covering stock cost; 2.0+ is needed to cover operating expenses and generate profit; 3.0+ is the target for most CPG and general merchandise categories
GMROI is the single most useful metric for deciding what to stock, what to expand, and what to cut. It answers one question: for every £1 invested in this inventory, how much gross profit did it generate?
A product with high margins but slow turnover may generate the same GMROI as a low-margin, high-velocity product. GMROI collapses these variables into one number and makes comparison clean.
| GMROI Level | What It Means |
|---|---|
| Below 1.0 | You're losing money on this inventory |
| 1.0 to 2.0 | Covering stock cost; likely not covering operating overheads |
| 2.0 to 3.0 | Reasonable return; competitive in many categories |
| 3.0+ | Strong return; healthy target for most mid-market retailers |
The practical application of GMROI for UK mid-market retailers is in ranging decisions. When you're constrained on floor space, warehouse space, or open-to-buy budget, GMROI tells you objectively where to focus. Categories with GMROI below 1.5 on the same space that a 3.0+ category could occupy are a business case for range rationalisation, not a gut feel.
 Caption: Real-time inventory dashboards like this make GMROI, turnover, and availability tracking visible at a glance -- without building the report manually. Source: Bold BI
Given that business rates in the UK make inefficient space utilisation particularly costly -- especially following relief reductions in 2025 -- GMROI by floor or shelf space is one of the most actionable calculations a mid-market retailer can run.
9. Inventory Carrying Cost -- The Silent Margin Killer
Includes: Warehouse / storage costs, insurance, financing / cost of capital, labour, shrinkage and obsolescence write-offs
Typical range: 20% to 30% of inventory value annually
Most UK mid-market retailers underestimate their carrying costs -- not because they can't calculate them, but because the components sit across multiple budget lines. Warehouse costs are in property. Insurance is in finance. Shrinkage is in operations. Labour is in people. Nobody adds them up and then applies the total to the inventory balance.
When you do, the number is usually a shock. Carrying 20% to 30% of inventory value as an annual cost means that £2 million in average stock is costing you £400,000 to £600,000 a year just to hold -- before a single unit is sold or lost.
📊 Illustrative carrying cost breakdown for a £2M average inventory retailer
Storage / rent allocation   ███████████████  35%  (£175,000)
Shrinkage / write-offs      ████████████     28%  (£140,000)
Labour (stock management)   ████████         18%  (£90,000)
Insurance                   ████             10%  (£50,000)
Financing cost / capital     ████             9%  (£45,000)
Total: ~£500,000/year on £2M average inventory
The implication: excess inventory isn't just a cash flow problem. It's a profit and loss problem. Reducing average inventory by 15% through better demand forecasting and tighter reorder discipline doesn't just free cash -- it can directly improve operating margins by 3-5 points.
10. Forecast Accuracy -- The Leading Indicator That Drives Everything Else
Formula: Typically measured as 1 minus the Mean Absolute Percentage Error (MAPE); a score of 80%+ is broadly considered acceptable; best-in-class retailers target 90%+
A common format: Forecast accuracy = 1 - (|Actual - Forecast| / Actual) x 100
Every other inventory KPI in this list is, to some degree, a lagging indicator. Stockout rates tell you availability has already failed. DIO tells you stock has already accumulated. Carry costs tell you money has already been spent.
Forecast accuracy is the leading indicator. Get it right, and the rest of the metrics tend to follow. Get it wrong, and you're in a cycle of either perpetual overstock or constant firefighting against empty shelves.
The challenge for UK mid-market retailers in 2026 is that traditional forecasting methods -- moving averages, seasonal patterns, buyer intuition -- are increasingly inadequate. McKinsey research found that AI-based forecasting can reduce supply chain forecasting errors by 20% to 50% compared to conventional methods. Gartner's September 2025 research suggested 70% of large organisations would adopt AI-based supply chain forecasting by 2030. For mid-market operators, the timeline is shorter than they may expect.
| Forecasting approach | Typical accuracy | Best application |
|---|---|---|
| Manual / spreadsheet | 60-70% | Stable, predictable SKUs only |
| Statistical models (moving average, etc.) | 70-80% | Steady demand, seasonal patterns |
| ML-based forecasting (gradient boosting, etc.) | 80-90% | SKU-level, volatile demand |
| AI foundation models | 85-92% | Complex multi-factor demand signals |
Source: LEAFIO, Appify Intelligence, McKinsey
The honest caveat from a May 2026 analysis of mid-market AI forecasting deployments: the vendor pitch (30-50% stockout reduction, light rollout, fast ROI) rarely matches implementation reality. The most defensible approach for a mid-market operator is to deploy ML forecasting at the 4-week horizon on volatile SKUs -- not to replace demand planning wholesale, but to add precision where human judgment is least reliable.
Ask yourself: What percentage of your stock orders in the last 12 months were emergency replenishments? If it's more than 10%, your forecast accuracy is almost certainly the root cause -- not your supplier.
11. Lost Sales -- The Revenue That Never Appears in Any Report
Formula: Estimated demand - Actual sales during stockout period
This is the KPI most retailers don't track, even though it's arguably the most important number in the building. Lost sales represent demand that existed, customers who were willing to spend, and revenue that evaporated not because of competition or pricing -- but because the product wasn't available when the customer arrived.
The calculation requires demand estimation, which is why most retailers avoid it. But the estimation doesn't need to be precise to be useful. If a product typically sells 50 units per week and it was out of stock for three days, a reasonable lost sales estimate is approximately 21 units at the product's average selling price. Multiplied across your top 50 stockout SKUs over a 12-month period, the number is usually large enough to justify significant investment in availability improvement.
"Many retailers only analyse completed sales. Lost sales analysis helps identify demand that went unmet -- one of the most valuable insights for improving replenishment." -- GrowSights inventory framework
Research by Appriss Retail found that two-thirds of customers experiencing a stockout leave a physical store without buying the item. They don't ask staff, they don't come back the next day. They leave -- and in categories with strong brand alternatives, they may not return at all.
For mid-market retailers running in the £5-50 million revenue range, the value of a rigorous lost sales analysis is often the single most compelling argument for investing in real-time availability tracking. The ROI case writes itself. GrowSights clients using the Stockouts tool typically find £20,000 or more in recoverable lost revenue in the first week of a pilot -- not because the problem is new, but because it was never ranked, quantified, or surfaced before.
12. Fill Rate -- The Fulfilment Promise You're Keeping (or Not)
Formula: (Orders fulfilled from available stock / Total orders received) x 100
Healthy benchmark: 95%+ for retail replenishment to stores; 98%+ for direct-to-consumer; 90%+ considered acceptable for B2B supply into retail
Fill rate is the operational metric most directly experienced by your customer -- or by the store if you're a supplier. It measures whether you can actually fulfil demand when it arrives, not just whether you have product somewhere in your system.
The distinction from on-shelf availability is important. OSA measures what's visible and accessible to the customer at the shelf. Fill rate measures what's fulfilled from the point of order -- whether that's a wholesale order, an online purchase, or an in-store replenishment request.
| Fill Rate Level | Interpretation |
|---|---|
| 98%+ | Excellent; minimal lost orders |
| 95-98% | Acceptable; monitor for trend deterioration |
| 90-95% | Concerning; investigate root causes by SKU |
| Below 90% | Significant operational problem; customer relationships at risk |
A rising backorder rate is often the first visible symptom of a deteriorating fill rate -- which in turn points to supplier delays, inadequate safety stock, or poor demand forecasting at the replenishment trigger point.
13. Shrinkage Rate -- The Metric That's Now a Board-Level Concern
Formula: (Recorded inventory - Physical inventory) / Recorded inventory x 100
UK benchmark (2025): Industry shrink rate of 1.4% to 1.7% of retail sales (NetSuite UK, BRC data)
UK retail shrinkage has moved from an operational metric to a board-level priority. The numbers are stark. UK retail sales totalled £531.6 billion in the 12 months ending November 2025, according to ONS. At the industry's 1.4% to 1.7% shrink rate, that's £7.5 billion to £9 billion in annual losses -- with UK retailers spending a further £1.8 billion per year on prevention measures, according to the BRC.
What makes UK shrinkage particularly acute is its composition. Research from Retail Economics found that 40% of the total value of UK retail theft is attributable to employees -- higher than the global average -- with distribution centres emerging as hotspots for organised criminal activity.
📊 UK Retail Shrinkage trajectory (projected)
2020  ██████████████████             £5.3bn (est.)
2021  ████████████████████           £6.0bn (est.)
2022  ██████████████████████         £6.8bn (est.)
2023  █████████████████████████████  £7.9bn (20-year high)
2024  ██████████████████████████████ £8.4bn (est.)
2025  ███████████████████████████████£9.0bn (projected)
Source: Deloitte / BRC / NetSuite UK 2026
The secondary impact of shrinkage that most mid-market retailers underestimate is its effect on inventory accuracy. Stolen or damaged stock that isn't immediately recorded creates phantom inventory -- products the system believes exist but don't. This corrupts replenishment signals, inflates apparent fill rates, and can mask genuine demand signals for months.
For a mid-market retailer turning over £100 million, even the lower end of the industry shrink rate translates to £1.4 million in direct losses annually -- before prevention costs. That's a compelling number to present to any leadership team questioning the ROI of better inventory tracking.
 Caption: Empty shelves represent both a lost sale and a customer relationship at risk. Two-thirds of UK shoppers experiencing a stockout leave without buying. Source: Getty Images
14. Stock-to-Sales Ratio -- Balancing Investment Against Demand
Formula: Inventory Value / Net Sales
Interpretation: Higher ratios indicate excess inventory relative to demand; lower ratios risk stockouts; the optimal ratio varies by sector and replenishment lead time
The stock-to-sales ratio is the metric that sits at the intersection of finance and operations. Finance uses it to assess working capital efficiency. Operations uses it to assess whether buying levels are appropriate for the sales run rate. When the two functions disagree on stock levels, this ratio is often the most productive place to start the conversation.
A stock-to-sales ratio of 1.5 means you're holding 1.5 months of inventory relative to your current sales rate. Whether that's healthy depends entirely on your sector, lead times, and service level commitments. A grocery retailer at 1.5 is almost certainly overstocked. A fashion retailer at 1.5 before the peak season may be understocked.
| Sector | Typical healthy stock-to-sales ratio |
|---|---|
| Grocery / FMCG | 0.05 to 0.15 (days, not months) |
| Fashion / apparel | 1.0 to 2.5 (varies heavily by season) |
| Beauty & health | 0.8 to 1.8 |
| Pet care / specialist | 1.0 to 2.0 |
| Home / furniture | 2.0 to 4.0 |
Source: GrowSights estimates based on sector inventory turnover benchmarks
The most valuable use of this metric is in trend monitoring, not point-in-time comparison. A stock-to-sales ratio that's been rising for three consecutive months is an early warning signal of either slowing demand or aggressive buying that hasn't been corrected. Catching it in month two is worth far more than diagnosing it in month five.
15. Reorder Lead Time -- The Constraint That Shapes Every Other Number
Formula: Average time (days) between placing a purchase order and receiving usable stock
Typical ranges (2026 context): UK domestic suppliers: 7-21 days; European suppliers: 14-35 days; Far East/Asian sourcing: 60-120+ days
Reorder lead time isn't a glamorous metric, but it's the constraint that determines how every other inventory KPI needs to be calibrated. Your safety stock levels, reorder points, fill rate targets, and even your OSA benchmarks all depend on how long it takes to get more stock when you need it.
The 2025-2026 supply chain environment has made lead time tracking more critical than it was in the relative stability of 2019-2022. AXA Commercial's mid-market retail analysis found that over 55% of UK exporters reported supply chain disruptions in recent periods, and average shipment delays extended to 3-4 weeks across key categories. Container shipping cost surges of up to 300% added further unpredictability.
The practical implication: best-in-class operations achieve 18.7-day average lead times (Netstock 2025), while underperforming operations endure 63.1 days -- more than three times longer. That 44-day gap creates a compounding disadvantage: higher safety stock requirements, more emergency purchases, worse cash conversion, and lower flexibility to respond to demand signals.
Key insight for retail leaders: Most mid-market retailers know their average lead time. Fewer track lead time variance -- the standard deviation around that average. It's the variance, not the mean, that determines how much safety stock you actually need. A supplier with a 30-day average lead time but a 10-day variance is far more manageable than one with a 25-day average and 20-day variance.
 Caption: Barcode and RFID-enabled inventory counting dramatically improves accuracy and lead time visibility in retail operations. Source: Biyo POS
16. The Metrics That Most UK Mid-Market Retailers Are Getting Wrong
Research and real-world patterns point to consistent failure modes in how mid-market UK retailers track and use inventory KPIs.
Failure 1: Measuring averages instead of distributions
An average stockout rate of 3% can hide a situation where 20% of your core range is perpetually out of stock while the remaining 80% is fine. The average is meaningless without the distribution underneath it. The same applies to inventory turnover, fill rate, and forecast accuracy.
Failure 2: Treating KPIs as reporting rather than operating tools
The retailers that actually improve their inventory performance review fast-moving KPIs -- availability, stockout rate, fill rate -- weekly or even daily, and they're connected to someone with the authority to act. A monthly board pack showing last quarter's shrinkage rate isn't inventory management. It's archaeology.
Failure 3: Running inventory KPIs in silos
As noted in our thinking on UK mid-market growth challenges, the most common failure mode is not the absence of data -- it's the absence of integration. Sales data sits in the POS. Inventory data sits in the ERP. Supplier data sits in spreadsheets. Nobody has one view of what's actually happening at the shelf, in the warehouse, and in the pipeline simultaneously. This is precisely what GrowSights solutions are built to fix: Stock Truth unifies every inventory data source into a single live dashboard, while Stockouts and Monday Report turn that picture into ranked alerts and automated weekly trading reviews.
Failure 4: Optimising for the wrong thing
A GMROI target that's too high can push buyers to reduce investment in lower-margin but high-traffic categories that drive footfall. A DIO target that's too aggressive can create stockouts in the pursuit of working capital efficiency. Every inventory KPI has a shadow metric -- the thing you break when you optimise too hard in one direction. The best retail operators track their KPIs in combinations, not in isolation.
| KPI being optimised | The shadow metric to watch |
|---|---|
| Low DIO (cash efficiency) | Rising stockout rate |
| High sell-through rate | OSA approaching 100% -- risk of stockouts |
| Low carrying cost | Safety stock too thin -- vulnerability to lead time variance |
| High GMROI | Range gaps in essential / traffic-driving categories |
| Low shrinkage spend | Rising shrinkage rate (under-investment in prevention) |
17. How to Build an Inventory KPI Cadence That Actually Works
Tracking 15 KPIs sounds like a significant overhead. In practice, the cadence isn't as demanding as it looks -- if the data infrastructure is right.
Daily (operational layer)
- On-shelf availability by store and category
- Stockout rate -- new outs and duration
- Fill rate on inbound replenishment
- Reorder triggers and open purchase orders
Weekly (commercial layer)
- Sell-through rate by category and top-50 SKUs
- Inventory accuracy -- cycle count results
- Lost sales estimate by SKU
- Backorder rate
Monthly (management layer)
- Inventory turnover by category
- GMROI by category and buyer
- Days Inventory Outstanding
- Stock-to-sales ratio vs. prior month
- Carrying cost review
- Shrinkage by location
- Forecast accuracy vs. actuals
Quarterly (strategic layer)
- Lead time performance by supplier
- Reorder point review and recalibration
- Safety stock optimisation
- Year-on-year KPI trend review
The cadence above assumes your data is consolidated -- which, as discussed, is the fundamental challenge for most mid-market operators. If availability data sits in the store system, inventory accuracy in the ERP, and lost sales has to be manually estimated from a spreadsheet, this cadence isn't realistic. That's the infrastructure problem to solve first.
As noted in our analysis of the SaaS stack tax on retail margin, many mid-market retailers are already paying for multiple systems that should be providing this visibility -- and getting it from none of them because the systems don't talk to each other.
18. Key Lessons for Retail Leaders
Lesson 1: Inventory accuracy is not a data project -- it's an operational discipline
The technology for inventory accuracy exists and is increasingly affordable. RFID tags, cycle counting protocols, automated discrepancy alerts -- these are not enterprise-only capabilities in 2026. The reason most mid-market retailers don't achieve 95%+ accuracy is not that they lack the tools. It's that accuracy is treated as a periodic audit rather than a continuous operating standard.
Ask yourself: When did you last do a cycle count of your top 100 SKUs? If the answer is "quarterly" or "annually," you are operating with a phantom inventory problem and you don't know how large it is.
Lesson 2: The five KPIs that compound most powerfully are not the five most commonly tracked
Retailers typically track inventory turnover, shrinkage, and GMROI -- the financial metrics. The KPIs with the highest operational leverage are inventory accuracy, on-shelf availability, forecast accuracy, lost sales, and reorder lead time variance. These are the leading indicators that determine whether the financial metrics will improve. Most retailers track the consequences and ignore the causes.
Lesson 3: Speed of reaction matters more than precision of measurement
A 90% accurate stockout alert that triggers a replenishment action within 24 hours is worth far more than a 99% accurate stockout report delivered in a weekly pack. The competitive advantage in inventory management in 2026 is not who has the best KPI dashboard. It's who can act on the signal fastest. This requires data integration, alert logic, and decision authority pushed down to the people who can actually fix the problem.
Lesson 4: Mid-market operators can close the gap faster than they think
The narrative that AI-driven inventory management is only for enterprise retailers with massive data science teams is wrong. The 2026 AI forecasting market offers affordable, purpose-built tools for retailers from £5 million to £100 million in revenue. The blocker is rarely capability -- it's the fragmented data estate that makes any tool unreliable. Fix the data first. Then the tools work.
19. Actionable Recommendations
For Retail CEOs and Business Owners
- Run a single integrated inventory accuracy audit across all locations before investing in any new technology. You need to know your baseline.
- Establish a weekly commercial rhythm where availability, stockout rate, and sell-through are reviewed by someone with buying authority -- not just reported to them.
- Calculate your carrying cost as a percentage of average inventory. If you don't know this number, you don't know your real cost of capital.
- Identify your top 10 lost sales SKUs from the last 12 months. This is the most direct ROI conversation you can have about inventory improvement.
- Review lead time by supplier against your safety stock levels. If your safety stock hasn't been recalibrated since lead times extended in 2023-2024, it's almost certainly wrong.
For B2B Leaders and Suppliers to Retail
- Track fill rate to your retail customers not as a single number but as a distribution. Which customers, categories, and SKUs are you failing most consistently?
- Offer your retail customers lead time variance data alongside average lead time. This is the number they need to set safety stock -- and most suppliers don't provide it.
- Understand your retail customers' GMROI on your categories. If you don't know whether your products are generating acceptable returns, you're negotiating blind.
- Help retail buyers identify lost sales opportunity in your categories. A supplier who brings OSA and lost sales data to a range review has a fundamentally different relationship with the buyer than one who brings sell-in targets.
For Finance and Operations Leaders
- Build inventory carrying cost as a standing line in monthly management accounts. It belongs next to COGS, not in a footnote.
- Establish DIO targets by category rather than as a business-wide average. Fashion buyers and grocery buyers need completely different targets.
- Treat forecast accuracy as a KPI with an owner, a baseline, and a quarterly improvement target. If nobody owns it, it won't improve.
- Connect your inventory KPI review to your cash flow forecast. A rising DIO trend is a working capital alert. It should reach the CFO as such.
20. Final Summary
| KPI Category | What It Measures | Why It's Critical in 2026 |
|---|---|---|
| Inventory Accuracy | System vs. physical match | Root cause of phantom inventory, stockouts, bad forecasts |
| On-Shelf Availability | What customers can actually buy | Every 1% improvement = 0.5% sales uplift |
| Stockout Rate | How often shelves fail | 69% of affected customers buy from a competitor |
| Inventory Turnover | Speed of stock cycling | Cash flow and carrying cost control |
| Sell-Through Rate | Product-market fit by SKU | Early warning for overstock and range failures |
| Days Inventory Outstanding | Working capital efficiency | Determines how much cash is locked in stock |
| GMROI | Profit per £1 of inventory | Objective basis for ranging and space decisions |
| Inventory Carrying Cost | Total cost of holding stock | Usually 20-30% of inventory value -- often untracked |
| Forecast Accuracy | Replenishment quality | Leading indicator for all other inventory performance |
| Lost Sales | Unmet demand | Most impactful invisible metric in the business |
| Fill Rate | Fulfilment promise kept | Customer and retail partner trust |
| Shrinkage Rate | Stock lost to theft, error, damage | UK rate at 20-year high; rising to ~£9bn in 2025 |
| Stock-to-Sales Ratio | Inventory vs. demand balance | Early warning for excess stock accumulation |
| Backorder Rate | Demand we couldn't fulfil | Signal of forecasting or safety stock failure |
| Reorder Lead Time | Supplier constraint | Determines all safety stock and reorder calculations |
Make Your Inventory Data Work as Hard as Your Team Does
Most mid-market UK retailers already have the data they need to manage inventory better. The problem isn't data -- it's that the data sits in three different systems, requires four hours to consolidate into a spreadsheet, and is reviewed three weeks after the decision needed to be made.
GrowSights has built three tools that tackle different parts of this problem. Stockouts connects to your daily retailer portal data and ranks every empty shelf by the revenue it's costing you per day -- with the exact action attached. Stock Truth unifies every inventory data source (ERP, 3PL, retailer portals, distributors, Shopify) into one live dashboard with a Monday 7am alert before stockouts cost you sales. Monday Report automates your weekly WSSI trading review, saving 8-10 hours per planner every single week from week two. You don't need all three from day one. You need the one that maps to where the pain is right now. See the full solutions overview.
The retailers that pull away from the pack in 2026 won't be the ones with the biggest inventory. They'll be the ones who know exactly what their inventory is telling them -- and can act on it faster than anyone else.
If you want to see what your inventory data is telling you right now, Stockouts is free to try with a single retailer file and results in 10-20 minutes. Or start a conversation with GrowSights and we'll tell you exactly which problem to solve first.
Research sources:
- IHL Group, Inventory Distortion Global Estimates 2025
- NetSuite UK, Retail Shrinkage Analysis, March 2026: netsuite.co.uk
- British Retail Consortium (BRC), Crime and Shrinkage Reports 2023/24
- ONS, Retail Sales Data, November 2025 and October 2025
- Deloitte, Retail Shrinkage Analysis 2024
- AXA Commercial, Mid-Corporate UK Retail Sector Analysis 2025
- AisleStock, Inventory Turnover Benchmarks by Industry 2026: aislestock.com
- Onramp Funds, Inventory Turnover Benchmarks 2025
- Appriss Retail, Phantom Inventory and OSA Research 2025
- Harvard Business Review, Stockout and Customer Switching Research
- McKinsey & Company, AI in Supply Chain Forecasting 2022
- Gartner, AI Supply Chain Forecasting Adoption Forecast, September 2025
- Appify Intelligence, AI Demand Forecasting for Mid-Market, May 2026
- Netstock, Best-in-Class Wholesale Operations Lead Time Report
- Swell / Anchor Group, Wholesale Inventory Management Statistics 2025/2026
- Unleashed Software, Inventory Accuracy Research
- PwC UK, Retail Outlook 2025
- LEAFIO, AI Demand Forecasting Platforms Review 2026
Published by GrowSights | Retail Intelligence and Growth Engineering | Point of View