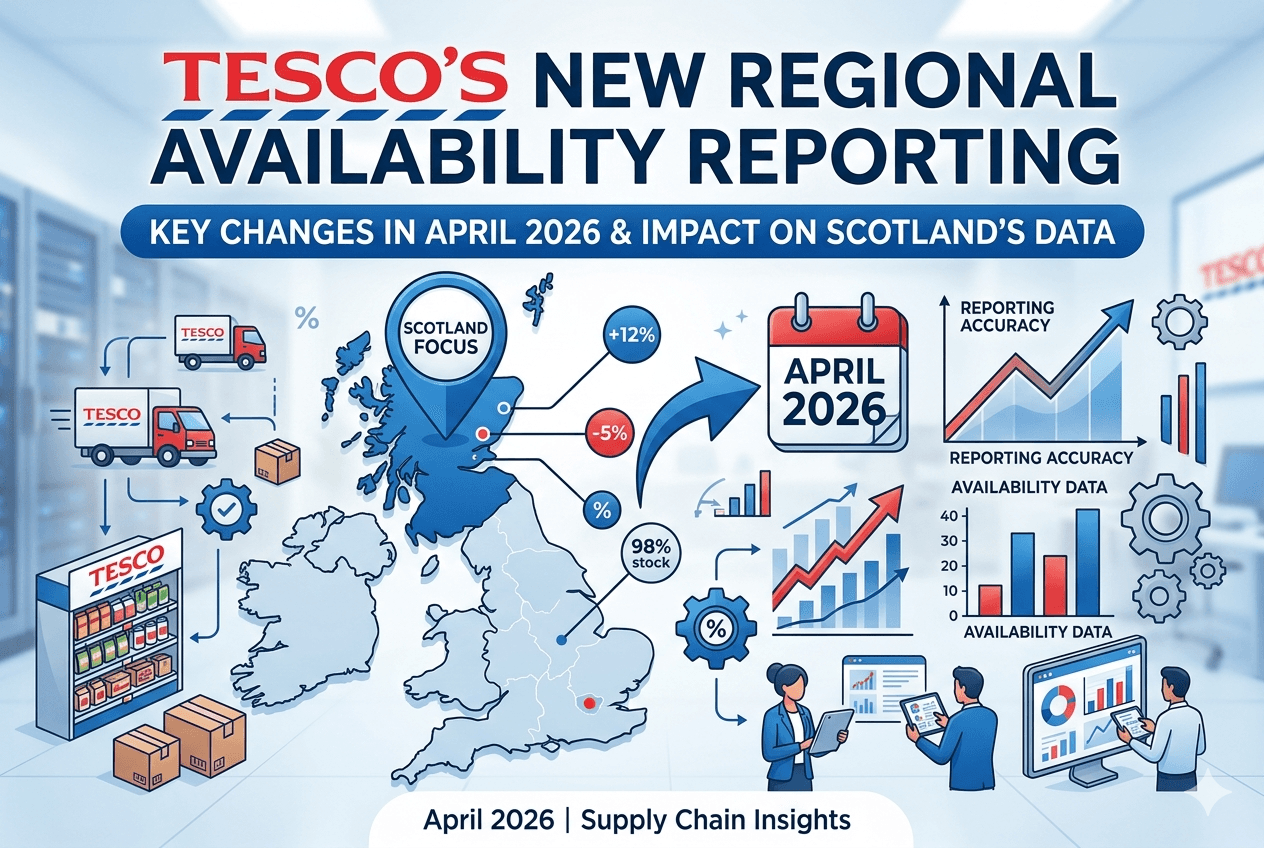
Tesco's New Regional Availability Reporting: What Changed in April 2026 and Why Your Scotland Numbers Look Different
Something changed in the Tesco supplier portal in April 2026. If you supply into Tesco and you logged in expecting the usual summary, you found something different. Your national availability figure was still there. But underneath it, for the first time, were regional breakdowns. Scotland had a number. London had a number. The North had a number. And they were not the same.
For suppliers who have spent years managing their Tesco relationship on a single blended national figure, this was either a moment of clarity or a moment of confusion, depending entirely on whether you knew how to read what you were looking at.
This piece is for the second group. We will cover exactly what changed, why your Scotland figure is almost certainly lower than your London figure regardless of what you are actually doing operationally, and what the new format is actually telling you that the old one was not.
We will also cover what to do with the information now that you have it, because data without a decision framework is just noise. And mid-market suppliers navigating Tesco account relationships on lean commercial teams do not need more noise.
Why This Change Matters More Than It Looks
Before April 2026, Tesco's supplier portal reported availability as a single national figure. You saw one percentage. That number covered every store Tesco operates across the UK, from Inverness to Penzance, compressed into a single data point that smoothed over everything underneath it.
That smoothing had real consequences for how suppliers managed their accounts. A supplier with strong performance in London and the South East and persistent gaps in Scotland could sit at 95% nationally and never be prompted to look deeper. The problem was invisible because the metric was designed to hide it.
Tesco operates just under 3,000 stores across the UK. Scotland accounts for around 224 of those stores, roughly 8% of the total UK estate. London and the South East account for a far larger share. When you blend those regions into a single number, the performance of a small, structurally different region like Scotland barely registers on the national metric, even when something real is happening there.
The move to regional reporting changes that. For the first time, suppliers can see where their product is actually performing and where it is not. That is commercially significant. The problem is that reading the new format incorrectly leads to the wrong conclusions, and the wrong conclusions lead to the wrong conversations with your category manager.
What Actually Changed in the April 2026 Update
Tesco has quietly rolled out regional breakdowns in the supplier portal. The national summary remains, but below it you now have availability data split across six defined regions:
- Scotland
- North England
- Midlands
- Wales and West
- East and South East
- London
Each region now shows its own availability percentage, its own out-of-stock rate, its own gap-to-range figure, and, for suppliers in relevant categories, a regional distribution centre weeks-of-cover figure. The data refreshes on the same cycle as the national figure, so the regional breakdown is as current as any other metric in the portal.
This is not the first time Tesco has extended supplier portal functionality. Tesco Connect was originally launched to give suppliers greater insight into customer buying habits and promotional activity, with early pilots showing shortages reduced by more than a third when suppliers used forecast data to change how they worked. The April 2026 regional availability update follows the same logic: more granular data should lead to better supplier decisions, which should lead to better on-shelf performance. The direction of travel has been consistent for over a decade. The regional breakdown is the latest step in that direction.
What is new is the level of geographic specificity. Store-level data has existed in various forms through Tesco Connect for some time, but a usable, supplier-facing regional summary with consistent metric definitions across all six regions is a different thing. You no longer need to pull and aggregate store-level data yourself to see where your regional story diverges from your national one.
Why Scotland Looks Different: Three Reasons, Only One Is Your Problem
The first thing most suppliers notice when they open the new regional view is that Scotland is lower than the national average. Sometimes materially lower. The immediate instinct is to treat this as a supply chain failure and start investigating what went wrong.
That instinct is often wrong. There are three structural reasons your Scotland availability figure will almost always underperform your national figure, and only one of them is a problem you can or should fix.
Reason one: the distribution route introduces genuine lag
Tesco's Scottish stores are predominantly replenished from the Livingston and Dundee distribution centres. The logistics chain from those DCs to the furthest Scottish stores, including the Highland and Island stores that Tesco serves, involves longer road distances and less frequent delivery cycles than equivalent routes serving London or the Midlands.
Tesco's availability figure records an out-of-stock event the moment a shelf gap appears and the store's system registers it. It does not distinguish between a gap caused by a genuine supply failure and a gap caused by product that is already in the DC, already on a vehicle, and twelve hours away from the shelf. In Scotland, that distinction matters more than it does in a region where DCs are thirty minutes from most stores.
What this means in practice is that your Scotland availability figure carries a structural discount relative to what your actual supply performance would justify. If your Scotland figure is, say, 93% and your national figure is 96%, the three-point gap is not necessarily three points of avoidable failure. Part of it is geography.
Reason two: small store pools amplify individual store events
Scotland accounts for approximately 8% of Tesco's UK store estate, with around 224 stores. London and the South East have a substantially larger store count. When you calculate a regional average, the scale of individual store events is inversely proportional to the number of stores in the region. A single large-format Tesco Extra in Glasgow running out of your product on a Friday evening moves your Scotland regional figure considerably. The same event at a comparable store in London would barely register on the regional metric.
This is a mathematical reality, not a supply chain problem. It means that volatility in your Scotland figure week to week will be higher than volatility in your London or South East figure, even if your underlying supply performance is identical. A week where your Scotland figure drops sharply does not necessarily mean something went wrong. It may mean one busy store had one difficult weekend.
Reason three: post-promotional demand signal lag
If you ran any promotional activity touching Scottish stores in Q1 2026, or if Tesco ran a promotional period in your category that drove higher-than-usual volume through Scottish stores, the automated replenishment system may not have fully recalibrated to post-promotional demand levels before the April reporting change went live.
What this produces in the data is an availability dip that looks like a new problem but is actually an echo of a previous one. The promotional uplift drove higher-than-normal outbound from DCs. When promotion ended, the system took time to rebase its replenishment signal to normal demand. During that recalibration period, DC cover and store availability can both run lower than they would be once the signal stabilises.
If your Scotland figure deteriorated materially in April relative to February and March, check your promotional calendar before treating it as an operational failure. The timing may not be coincidental.
How to Read the New Format: A Column-by-Column Guide
The new portal layout presents four data columns for each region. Most suppliers are misreading at least one of them, and misreading any one of them leads to the wrong diagnostic.
Availability percentage
This is the percentage of store-hours within the reporting period where your product was recorded as available to purchase. A figure of 94% in Scotland means that across all Scottish stores and all hours in the period, 6% of potential shelf time was recorded as an out-of-stock event.
The critical thing to understand is that one large store running out for a full Saturday can move this figure by more than you would expect, particularly in Scotland where the store pool is smaller. A 94% figure does not mean that 6% of your stock went missing. It means that 6% of available shelf time in the region was recorded as a gap.
Compare this figure to your historical Scotland baseline, not to your national average. If your Scotland availability has historically run at 93 to 94% and it is showing 93.5%, you do not have a deteriorating situation. You have a stable one that happens to look low when compared to a national figure that is structurally different.
Out-of-stock rate
This is distinct from the availability percentage and is the more useful diagnostic number. It shows the proportion of stores within the region that recorded at least one out-of-stock event for any of your SKUs during the reporting period.
A high availability percentage and a high out-of-stock rate together tell you that while shelf time lost is relatively modest, the problem is spread across a large number of stores. That is a replenishment signal or ordering parameter problem. A low availability percentage and a low out-of-stock rate together tell you the opposite: a small number of stores are experiencing persistent, prolonged gaps. That is more likely to be a specific store or DC coverage issue.
These two figures need to be read together. Looking at availability percentage alone gives you a quantity of lost shelf time. Looking at out-of-stock rate alone gives you a breadth of the problem. You need both to know what you are actually looking at.
Gap-to-range
This is the most important new addition to the April format and the one most suppliers are ignoring. Gap-to-range shows the difference between what Tesco's range planning system expects your product to occupy in terms of shelf distribution and what was actually in place during the period.
A negative gap-to-range figure in Scotland often indicates that your product has not been ranged into all the stores it is supposed to be in, or that it has been delisted from stores without a corresponding update to your expected distribution. Before you start a conversation with your category manager about operational availability, check this figure. If your gap-to-range is negative, the conversation needs to start with ranging, not replenishment. You cannot have good availability in stores where you are not ranged.
A zero or positive gap-to-range figure confirms that your ranging is as expected, and any availability issues are genuinely operational. That is the version of the problem that replenishment conversations address.
Regional DC weeks-of-cover
This figure, where visible in your category, shows how many weeks of product supply are currently held at the regional distribution centre serving each area. It is the figure that most suppliers are not looking at and should be.
If your Scotland DC cover is sitting at four weeks or more while your in-store availability is below 95%, you have a replenishment frequency or order quantity problem, not a supply problem. The product exists in the system. It is not reaching store shelves at the right rate. That is a replenishment parameter conversation with your Tesco contact, specifically with the supply chain team rather than the buying team, and it is a very different conversation from one about your ability to supply.
Conversely, if your DC cover is below one week and your in-store availability is also low, you have a genuine supply issue. Your DC is not receiving enough product from you to maintain adequate stock at store level. That is a problem on your side of the relationship.
The pairing of DC cover and in-store availability is the fastest diagnostic in the new format. It tells you in seconds whether the problem is yours to fix or Tesco's to fix, and it determines which part of the Tesco organisation you should be talking to.
What Thresholds to Set Now That You Have Regional Data
The natural instinct when you first see regional data is to apply your existing national threshold across all regions. If you have been flagging anything below 96% nationally, you set 96% as the alert threshold for each region. That approach will generate noise in Scotland and Wales and hide problems in London.
Regional benchmarks need to be calibrated to regional baseline performance, not to a single national target. A threshold that is meaningful in London is too demanding for Scotland, given the structural factors we have covered. A threshold calibrated to Scotland may be too lenient for London, where the supply conditions are more forgiving and genuine problems should stand out more clearly.
The approach that works is this. Pull your last twelve weeks of regional data for each region and for each of your key SKUs. Calculate the regional average availability for each combination. Set your alert threshold at 1.5 percentage points below each regional average, and apply a floor of no lower than 91% regardless of regional average. This gives you thresholds that flag genuine deterioration relative to what is structurally achievable in each region, rather than flagging Scotland every week simply because geography means it runs lower.
For out-of-stock rate, a threshold of 15% of stores in a region experiencing at least one out-of-stock event in a given week is a reasonable starting point for most categories. Above that level, you have a pattern rather than an isolated incident and it warrants investigation. Below 10% is a position most suppliers should be able to maintain outside of promotional periods.
For gap-to-range, any negative figure greater than minus 5% in two consecutive reporting periods should trigger a ranging review conversation. A single-period negative figure can be an administrative lag. Two consecutive periods is a signal that something has changed in how your product is ranged in that region and needs to be investigated.
For DC cover, anything below 1.5 weeks should trigger an internal review of your replenishment schedule and whether you are shipping to Tesco's DCs at sufficient frequency and volume to maintain their stock levels. Anything above 6 weeks may indicate over-ordering by the DC, which can create its own problems further down the line when the DC draws down on that excess stock rather than ordering normally.
The Three Conversations You Now Need to Have Differently
Regional availability data changes the commercial conversations you have with Tesco. Not just the content of those conversations, but who they should be with and how you should frame them.
The category manager conversation
Your category manager sees the same data you do, from Tesco's side. They know the regional breakdowns exist. Going into a review with a clear, pre-prepared read on your regional performance positions you as a supplier that manages its account with commercial rigour. Going in without that read positions you as a supplier that is reacting to numbers Tesco surfaces.
The practical preparation for any category manager meeting now requires you to do two things your old process probably did not include. First, explain your Scotland number before they raise it. If it is low for structural reasons you understand, say so and show the DC cover data that supports that explanation. If it is low for operational reasons, say that too and show what you are doing about it. Second, present your out-of-stock rate alongside your availability percentage. The availability percentage alone tells a partial story. The out-of-stock rate adds the dimension of how many stores are affected, which is more actionable information for both sides.
The supply chain conversation
Regional availability data often reveals problems that belong in a supply chain conversation, not a buying conversation. If your gap-to-range is negative in Scotland, that is a ranging conversation. If your DC cover is adequate but in-store availability is low, that is a replenishment parameter conversation. Neither of those sits with your buyer or category manager. They sit with Tesco's supply chain team.
Many mid-market suppliers do not have an established relationship with the Tesco supply chain team separate from their buyer relationship. If regional availability data is surfacing problems that look like replenishment parameter issues, that is the moment to establish one. Your buyer can facilitate the introduction. The practical ask is straightforward: you have identified that DC cover in Scotland is adequate but in-store availability is running below your target threshold, and you would like to understand whether the replenishment parameters for Scottish stores are set correctly for your product velocity.
The internal commercial conversation
For mid-market suppliers in the range that Growsights works with, the Tesco account often represents a material proportion of total revenue. If your Scotland availability data is now showing you that you have been running a consistent 3 to 4 point gap between Scottish and London performance for an extended period, that gap has a volume consequence that probably never showed up clearly in your national reporting.
The calculation is not complicated. Take your estimated lost shelf time in Scotland as a percentage of total Scottish shelf time. Apply your average sell-through rate per available shelf-hour. Multiply by your average revenue per unit. That gives you a rough order of magnitude of volume that was available to sell in Scotland but was not captured because your availability was below where it should be. For most suppliers, that number is larger than expected. For some, it is material enough to change how they prioritise the Scotland relationship.
What This Data Is Not Telling You
Regional availability figures have limits, and those limits matter as much as what the data does tell you.
The availability percentage does not distinguish between product that was out of stock because you failed to supply it and product that was out of stock because Tesco's store ordering system failed to generate the right order. Tesco's replenishment is automated. When the system works correctly, it orders the right quantity at the right frequency to maintain store availability. When the system parameters are miscalibrated for a specific store, product, or region, it can under-order without any failure on your side.
Suppliers who treat every availability gap as their problem to fix end up in conversations about increasing their production or delivery frequency when the actual solution is a conversation about Tesco's replenishment settings. The DC cover figure is your best quick filter for distinguishing between these two situations, but it is not definitive. If you have persistent availability problems in a region where your DC cover appears adequate, it is worth specifically asking Tesco to audit the replenishment parameters for your SKUs in the affected region before you invest in operational changes on your side.
The out-of-stock rate does not tell you whether the out-of-stock was visible to a customer who wanted to buy your product or whether it occurred at a time when foot traffic was minimal. A store going out of stock at 11pm on a Tuesday costs you very little in actual lost sales. A store going out of stock at 11am on a Saturday morning costs you substantially more. The portal data does not currently give you that time-of-day dimension within the regional breakdown. When you are interpreting what an out-of-stock rate means commercially, that context matters.
A Note on What Comes Next
The April 2026 update is, by Tesco's standards, a moderate change to a portal that has been evolving incrementally for over a decade. The history of Tesco Connect shows a consistent pattern of extending data access to suppliers in ways that create collaborative supply chain benefits when suppliers use the data well. Regional availability reporting follows that pattern.
The suppliers who will benefit most from this change are not the ones who simply log in, look at the numbers, and panic about Scotland. They are the ones who build a reading discipline into their weekly commercial review process, who understand what each metric is actually measuring, who set sensible regional thresholds rather than applying national targets uniformly, and who use the data to have more precise conversations with Tesco rather than more reactive ones.
That is the practical difference between data and insight. The portal gives you data. What you do with it determines whether it becomes commercially useful.
The Broader Pattern We Keep Seeing
At Growsights, we work with mid-market retail brands where growth has stalled or margins are under pressure and the current data and tools are not surfacing the specific problem clearly enough to act on. The Tesco regional availability update is a useful example of a pattern we see repeatedly.
Data becomes available. Suppliers see numbers they have not seen before. Without the right analytical framework, those numbers produce anxiety rather than action. A supplier team spends three meetings discussing why Scotland is lower before anyone asks whether Scotland has always been lower and whether the current gap is actually different from normal.
The gap between having data and having a decision framework is where commercial performance leaks. It is not a tools problem. It is a diagnostic problem. The data is there. The insight is not, because nobody has built the process to turn one into the other.
That is work we do. We start by diagnosing the specific commercial situation, including how your data is being read and whether the decisions being made from it are the right ones. Then we engineer the solution that fits the actual problem.
If you are a mid-market supplier into Tesco or another major UK grocery multiple, and the new regional reporting is surfacing questions you are not sure how to answer, that is a reasonable place to start a conversation. We will tell you honestly within a week whether we think there is a specific problem we can help with, and if there is not, we will tell you that too.
Practical Summary: What to Do This Week
If you have not looked at the new regional format yet, here is the order of operations that makes sense.
Start by pulling the regional availability breakdown for your top five SKUs by Tesco revenue. Note which regions are below your national average and by how much. Do not draw any conclusions yet.
Then pull the DC cover figure for each region that is underperforming on availability. If cover is above 3 weeks and availability is low, the problem is replenishment parameters, not your supply. If cover is below 1.5 weeks and availability is low, the problem is supply volume.
Then check your gap-to-range figure for the underperforming regions. If it is negative, ranging is a precondition for solving anything else. You cannot improve availability in stores where you are not meant to be ranged.
Then build your regional baseline by pulling 12 weeks of historical data and calculating your regional averages. Set alert thresholds at 1.5 percentage points below each regional average, with a floor of 91%. Those thresholds should replace any national threshold you have been applying uniformly across regions.
Then prepare a one-page regional summary for your next category manager meeting. It should show your regional availability against your regional baselines, your DC cover figures, and a clear explanation of what you believe the Scotland gap reflects structurally versus operationally. Walk in knowing the numbers rather than waiting to see what Tesco surfaces.
That process takes a few hours. The commercial clarity it produces is worth considerably more.
Related Reading
- Growth has stalled across UK mid-market retail. The tools are not the problem.
- Your SaaS stack is a tax on your margin, and you are paying it voluntarily.
- What retail growth engineering means, and why this category needs to exist.
- Diagnostics vs data: knowing the difference.
- The diagnostic gap: why data is not insight.
- Unlocking mid-market potential.
Growsights is a retail growth engineering firm working with mid-market brands between £5M and £50M in revenue across the UK and US. We diagnose, engineer, embed, and prove. See how we work or start a conversation directly.